Amusement Parks Market Size and Share
Market Overview
| Study Period | 2019 - 2030 |
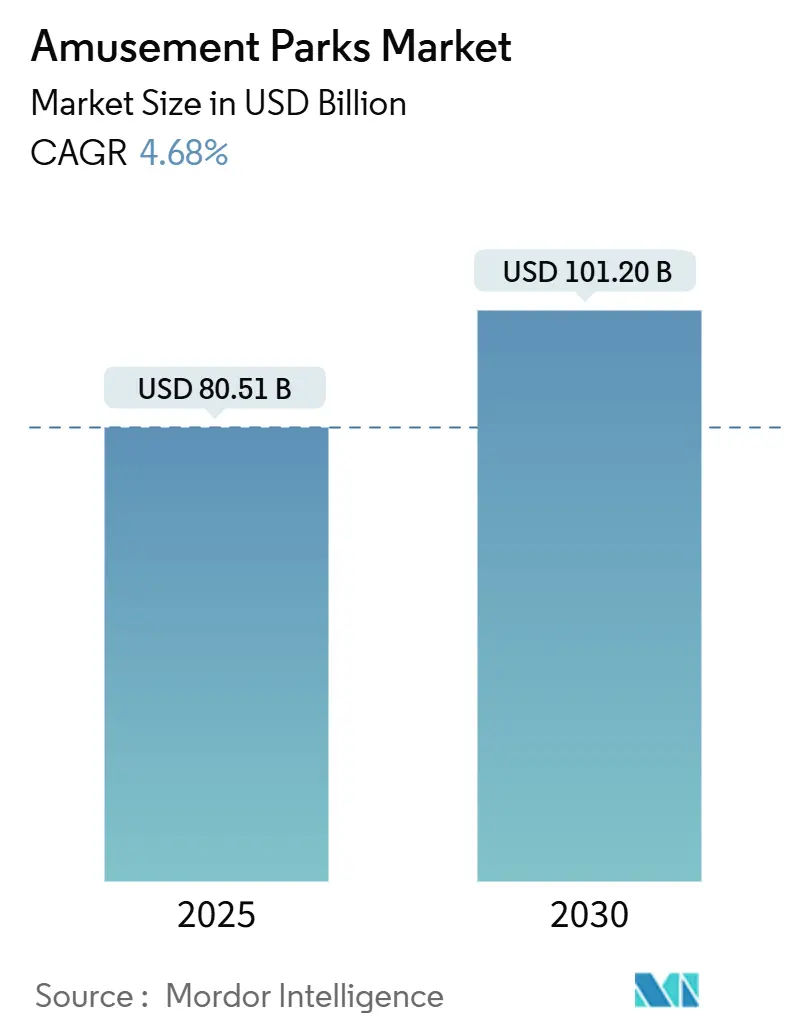
| Market Size (2025) | USD 80.51 Billion |
| Market Size (2030) | USD 101.20 Billion |
| Growth Rate (2025 - 2030) | 4.68% CAGR |
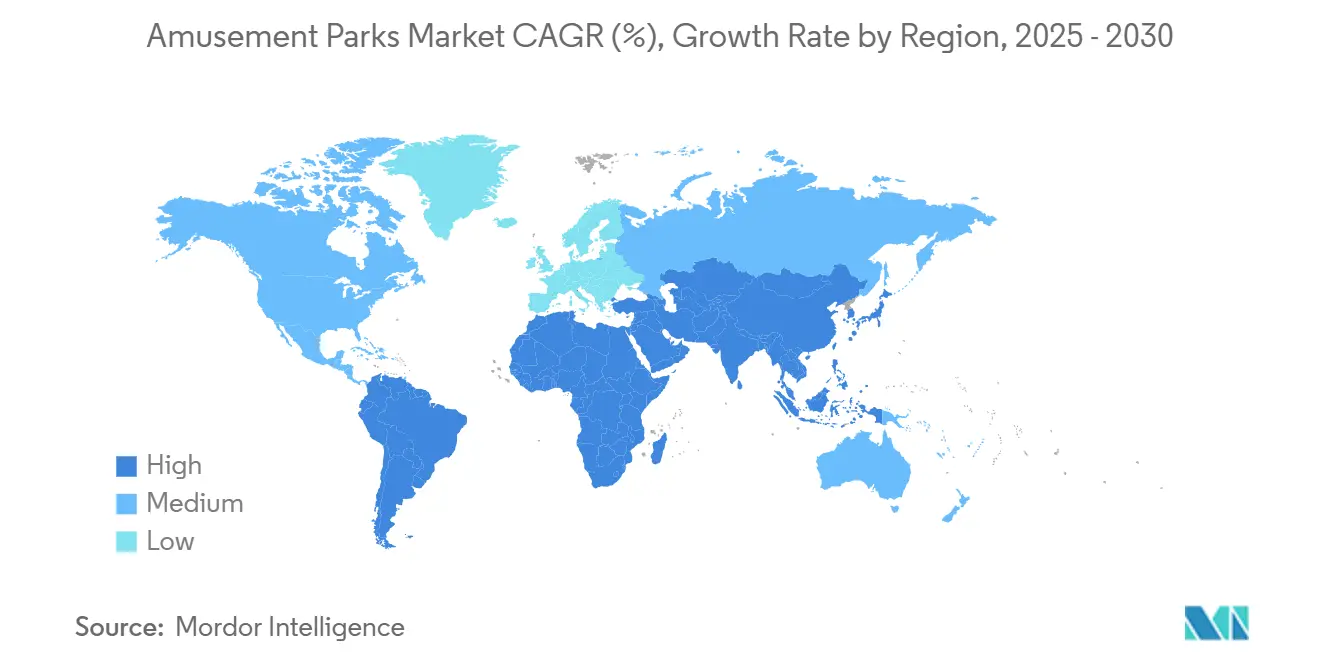
| Fastest Growing Market | Asia Pacific |
| Largest Market | North America |
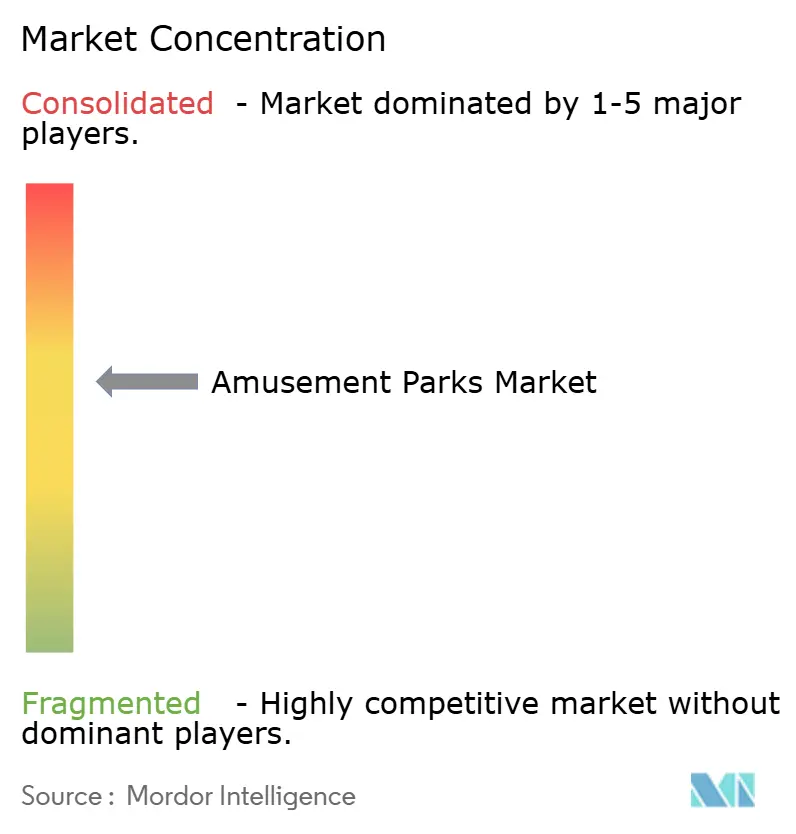
| Market Concentration | Medium |
Major Players
*Disclaimer: Major Players sorted in no particular order Image © Mordor Intelligence. Reuse requires attribution under CC BY 4.0. |
|
Amusement Parks Market Analysis by Mordor Intelligence
The amusement park market is valued at USD 80.51 billion in 2025 and is forecast to reach USD 101.20 billion by 2030, advancing at a 4.68% CAGR. Sustained demand for out-of-home leisure, rising middle-class disposable income in emerging economies, and strategic investments in immersive technologies underpin this expansion. Pent-up appetite for social experiences following pandemic restrictions continues to lift per-capita spend, while IP-based attractions and mixed-use resort formats extend average length of stay. Operators are accelerating hotel, dining, and branded merchandise initiatives to mitigate weather-related volatility and diversify cash flows. Technology adoption—particularly AI-powered dynamic pricing, queue management, and AR/VR ride systems—enhances capacity utilisation and guest satisfaction, positioning the amusement park market as a resilient pillar of the broader experience economy.
Key Report Takeaways
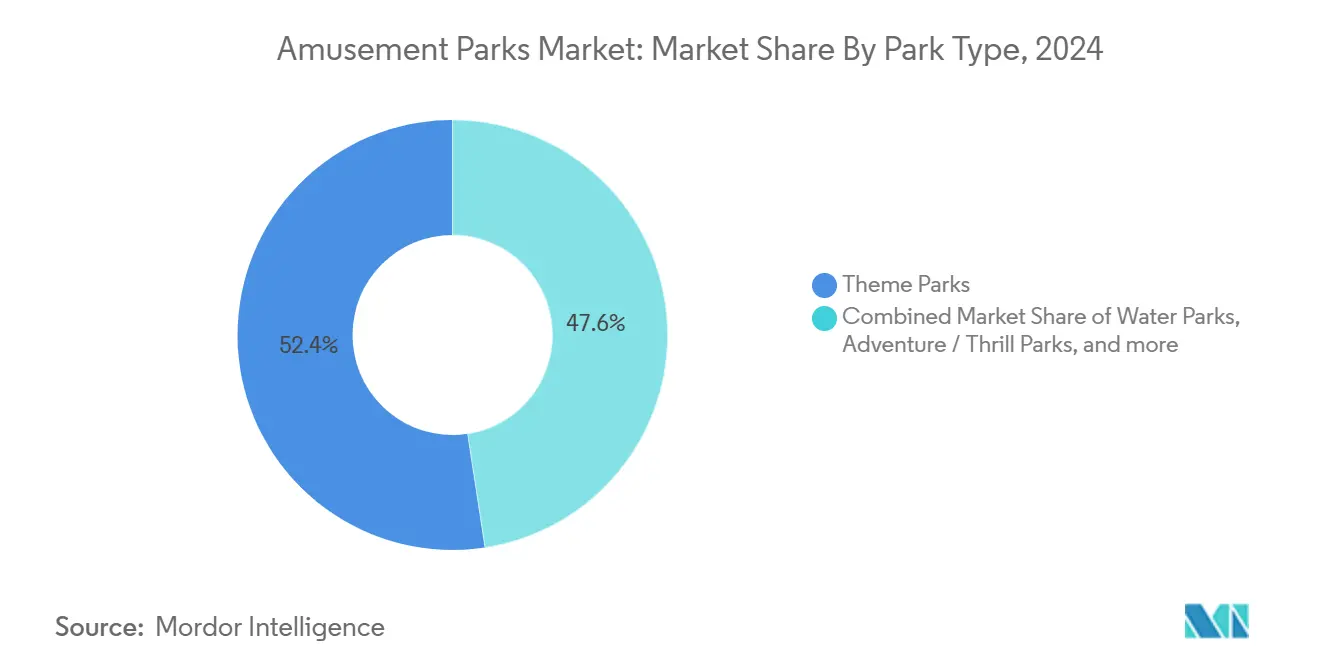
- By park type, theme parks led with 52.45% revenue share of the amusement park market in 2024; water parks are projected to expand at a 7.36% CAGR through 2030.
- By ride type, roller coasters accounted for 31.34% of the amusement park market size in 2024; AR/VR dark rides are growing at 10.63% CAGR.
- By revenue source, admission and ticketing contributed 49.89% of the 2024 amusement park market revenue; hotels and resorts are forecast to rise at an 8.50% CAGR.
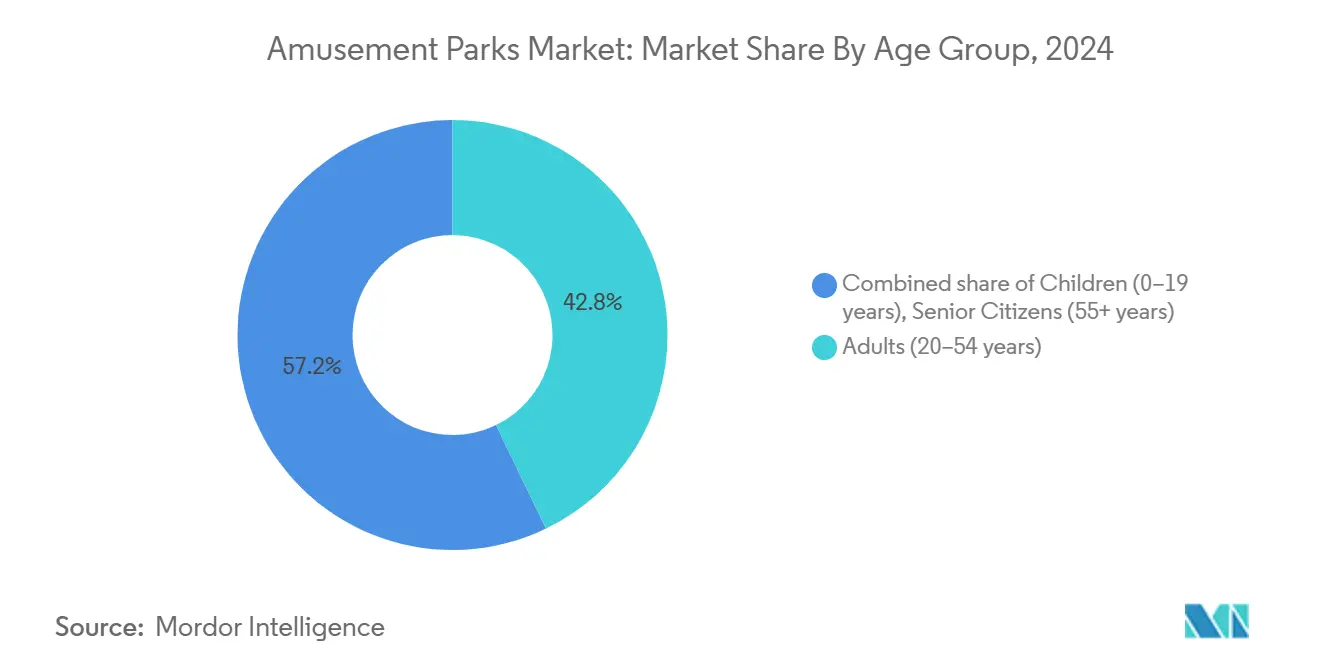
- By age group, adults (20–54) represented 42.83% share of the amusement park market in 2024, whereas the children segment is expanding at 6.57% CAGR.
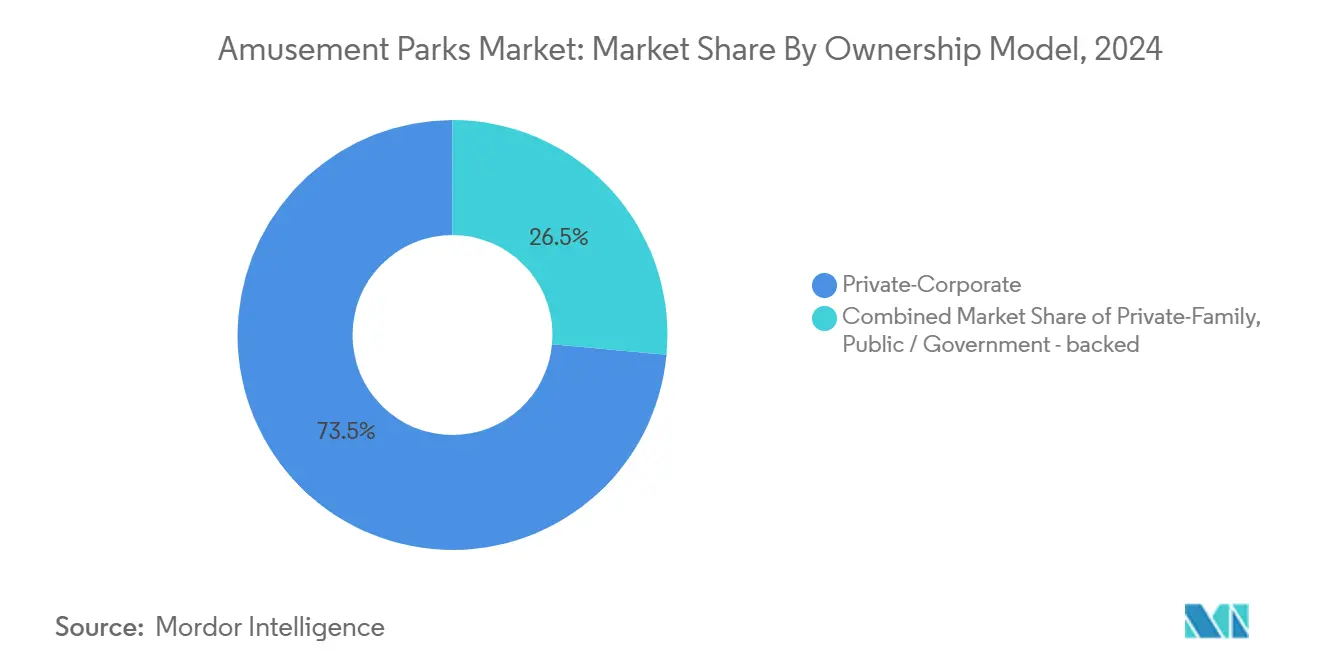
- By ownership model, private-corporate operators controlled 73.53% of global revenue of the amusement park market in 2024, but public and government-backed projects recorded the highest 6.34% CAGR
- By geography, North America captured 35.67% of the amusement park market share in 2024, while the Middle East is advancing at a 9.42% CAGR to 2030.
Global Amusement Parks Market Trends and Insights
Drivers Impact Analysis
| Driver | % Impact on CAGR Forecast | Geographic Relevance | Impact Timeline |
|---|---|---|---|
| IP-driven immersive experiences are elevating per-capita spend | +1.2% | Global, with premium impact in North America & Asia Pacific | Medium term (2-4 years) |
| Dynamic pricing & AI-based revenue optimisation | +0.8% | North America & Europe core, expanding to Asia Pacific | Short term (≤ 2 years) |
| Mixed-use resort integration extends visitor length-of-stay | +0.9% | Global, particularly strong in the Middle East & Asia Pacific | Long term (≥ 4 years) |
| Post-pandemic experience-economy rebound | +0.7% | Global, with varying recovery rates by region | Short term (≤ 2 years) |
| Modular water & surf-park technology lowering CAPEX barriers | +0.5% | Global, accelerated adoption in emerging markets | Medium term (2-4 years) |
| Data-driven personalisation boosting in-park spend | +0.6% | North America & Europe early adoption, Asia Pacific following | Medium term (2-4 years) |
Source: Mordor Intelligence
IP-Driven Immersive Experiences Elevating Per-Capita Spend
Intellectual-property storytelling converts rides into living narratives that lengthen dwell time, lift merchandise sales, and justify premium pricing. Universal’s USD 7 billion Epic Universe, launching in 2025, will bundle five distinct worlds to encourage multi-day visitation[1]NBCUniversal, “Epic Universe Fact Sheet,” nbcuniversal.com . Shanghai’s planned Harry Potter redevelopment targets 2 million annual guests and USD 150 million in revenue, underscoring IP’s revitalisation power. Operators leverage cross-platform franchises to monetise emotions across food, retail, and lodging, reinforcing competitive moats. As consumer attachment deepens, the amusement park market gains pricing latitude without sacrificing volume.
Dynamic Pricing & AI-Based Revenue Optimization
Borrowing from airlines, dynamic pricing tools use real-time demand signals to balance capacity and maximise yield. Disney and Universal report higher average ticket revenue despite controlled visitation, while European pioneer Tivoli Gardens combines AI guest segmentation with personalised offers to lift per-capita spend [2]International Association of Amusement Parks and Attractions, “Global Attractions Attendance Report 2024,” iaapa.org . Six Flags’ alliance with Google, HCL Tech, and Dell enables cloud-scale analytics that trigger on-site recommendations and off-peak discounts. Sophisticated revenue management supports affordable entry tiers for budget visitors and premium bundles for affluent segments, broadening appeal while sustaining margins. These capabilities amplify the predictability of the amusement park market and support continued capital deployment.
Mixed-Use Resort Integration Extending Visitor Length-of-Stay
Operators increasingly pair parks with hotels, retail promenades, and convention centres to convert single-day outings into multi-night vacations. Resorts World Sentosa’s [3]Resorts World Sentosa, “Expansion Overview 2025,” rwsentosa.com 1,100-key hotel expansion and waterfront lifestyle complex illustrate integrated growth built around core attractions. Silver Dollar City’s USD 500 million ten-year plan, including a 262-room lodge, shows regional brands pursuing similar strategies. Hotel & Leisure Advisors link water-park proximity to higher average daily rates and occupancy, cementing hospitality as a resilient revenue pillar. The approach cushions seasonal swings and provides stable cash flows that back long-term reinvestment, strengthening the amusement park market in volatile macro cycles.
Post-Pandemic Experience-Economy Rebound
IAAPA's 2024 survey indicates that 67% of Millennials are willing to pay a premium for exclusive experiences, while 75% are prepared to invest in privileges that reduce wait times. This highlights a growing consumer preference for enhanced and personalized offerings within the amusement park market. Additionally, analysis from investment bank Solomon Partners reveals that U.S. amusement parks have achieved record levels of monetization, even in the face of weather-related disruptions, demonstrating the resilience of discretionary spending in this sector. By shifting their focus toward delivering differentiated and value-added content rather than relying on discounting strategies, operators are effectively capturing sustained consumer demand. Consequently, the amusement park market is witnessing a stable and long-term growth trajectory, showcasing its ability to withstand cyclical economic fluctuations.
Restraints Impact Analysis
| Restraint | % Impact on CAGR Forecast | Geographic Relevance | Impact Timeline |
|---|---|---|---|
| High CAPEX & rising OPEX for new ride technologies | -1.1% | Global, particularly impacting smaller operators | Long term (≥ 4 years) |
| Competition from at-home digital & VR entertainment | -0.7% | North America & Europe core, expanding globally | Medium term (2-4 years) |
| Climate-change-driven weather volatility & insurance costs | -0.9% | Global, with severe impact on outdoor seasonal parks | Long term (≥ 4 years) |
| Sustainability / animal-ethics scrutiny on themed zoos | -0.4% | North America & Europe primarily, expanding to Asia Pacific | Medium term (2-4 years) |
Source: Mordor Intelligence
High CAPEX & Rising OPEX for New Ride Technologies
Next-generation coasters and media-rich attractions now command individual budgets matching entire small-park builds. Wonderla’s Chennai site invested Rs 515 crore (USD 62 million) for launch, with the flagship coaster alone costing Rs 70–80 crore (USD 8.4–9.6 million). In China, 40% of parks operate at a loss; Dayong Town attracted only 13 daily visitors after a USD 300 million outlay, illustrating the risk imbalance for under-capitalised developers. Labour shortages compound pressure, prompting Universal Studios Japan to recruit 200+ seniors to maintain service levels. Elevated expenditure funnels market power toward larger groups and slows greenfield expansion in the amusement park market.
Competition from At-Home Digital & VR Entertainment
Affordable VR headsets and endless streaming catalogues offer immersive thrills without travel, siphoning discretionary hours and budgets. In 2024, US park visitation dipped as families compared a Disney World holiday against cheaper overseas trips or home-entertainment upgrades. Gaming platforms like PlayStation VR2 and Meta Quest immerse users in fantasy settings that rival attraction storylines. Operators answer with in-park AR overlays and VR coasters, yet this escalates capital intensity while conceding that tech defines experience. Sustained innovation is now mandatory for the amusement park market to preserve relevance among digital-native audiences.
Segment Analysis
By Park Type: Theme Parks Dominate Despite Water Park Surge
Theme parks held a 52.45% amusement park market share in 2024, reflecting their role as anchor destinations that attract international tourism and catalyse mixed-use developments. Water parks recorded the fastest 7.36% CAGR, propelled by indoor facilities that permit all-season operations and modular surf lagoons requiring lower capital. Adventure, edutainment, and wildlife concepts fill experiential niches, while surf parks extend beach culture into urban interiors. Market leaders increasingly co-locate multiple park types to broaden demographic appeal and elevate per-capita spend.
Technological retrofits such as variable-speed pumps, solar arrays, and grey-water recycling suppress utility costs and support sustainability mandates, enhancing margins across formats. North American saturation has pushed incumbents to bundle water-park hotels with conferences to unlock incremental demand, whereas emerging Asian markets pursue first-wave rollouts. Chimelong Ocean Kingdom’s blend of marine exhibits, rides, and water attractions drew over 10 million visitors in 2024, exemplifying diversified clustering. Consequently, the amusement park market size for hybrid complexes is forecast to outpace single-type venues through 2030.
Note: Segment shares of all individual segments available upon report purchase
By Ride Type: Traditional Coasters Face AR/VR Disruption
In 2024, roller coasters represented 31.34% of the amusement park market, highlighting their role as key revenue drivers and core attractions. AR/VR dark rides, with a robust CAGR of 10.63%, offer cost-effective solutions for updating experiences without extensive infrastructure investments. Water slides and river rapids benefit from the rising demand in the aquatic entertainment segment, driving growth opportunities. Flat rides continue to attract family-oriented visitors, ensuring steady throughput and operational efficiency. Free-fall towers remain a cost-effective option for mid-tier thrill attractions, enhancing the diversity of amusement park portfolios.
Manufacturers integrate magnetic launches, on-board audio, and haptic seats to modernise classic coaster experiences. Screen-based rides merge physical motion with dynamic media, illustrated by Universal’s Transformers attraction, which can update content overnight. AI-powered motion platforms simulate variable narratives tailored to guest profiles, deepening personal engagement. These technology overlays help the amusement park market retain novelty while controlling construction expenditure.
By Revenue Source: Ticketing Foundation Shifts Toward Hospitality
Admission accounted for 49.89% of revenue in 2024, but its proportional dominance declines as hotels, resorts, and campgrounds post an 8.50% CAGR. Bundled stay-and-play packages stabilise earnings during inclement weather and shoulder seasons. Food and beverage operations enhance margins via limited-edition menus tied to blockbuster IP launches. Branded merchandise, especially personalised or location-exclusive items, commands strong premiums. Sponsorships and corporate events provide incremental, less season-sensitive income streams.
Hotel & Leisure Advisors emphasize that integrating water parks with resorts enhances both occupancy rates and Average Daily Rates (ADRs), reinforcing the strategic importance of hospitality in market growth. Wonderla plans to increase its resort revenue contribution from less than 5% to 10% by 2026, leveraging anticipated footfall growth to achieve this target. This approach aligns with global industry trends, showcasing a strategic shift toward revenue diversification. By diversifying, the company mitigates economic risks and enables more dynamic ticket pricing strategies. These measures are expected to drive volume growth and strengthen the amusement park market's overall performance.
By Age Group: Adult Market Anchors Children’s Growth
In 2024, adults aged 20-54 accounted for 42.83% of the market, significantly influencing travel preferences and discretionary spending patterns. The demographic of children under 19, driven by increasing birth rates in parts of Asia and higher family entertainment expenditures, is projected to grow at a robust 6.57% CAGR. Seniors represent an underserved segment with demand for gentler attractions and cultural experiences, indicating untapped potential for inclusive offerings. This highlights opportunities for businesses to cater to diverse age groups through tailored strategies. Addressing these demographic trends can unlock growth and enhance market competitiveness.
Universal Studios Japan's recruitment of experienced employees reflects its strategic response to labor shortages while enhancing services for older demographics. IAAPA's segmentation research identifies psychographic profiles that transcend age, enabling more precise and effective marketing initiatives. The expansion of Indian amusement park operators into tier-2 cities highlights the untapped potential of family-oriented demand in these regions. Companies like Wonderla and Imagicaa are diversifying their offerings to appeal to multi-generational audiences, aligning with evolving consumer preferences. This focus on customized experiences across different life stages is driving sustainable growth in the amusement park sector.
Note: Segment shares of all individual segments available upon report purchase
By Ownership Model: Government Investment Accelerates Market Entry
Private-corporate chains control 73.53% of global ticket receipts, yet public and government-backed parks log the top 6.34% CAGR through 2030. Sovereign-funded hubs in Saudi Arabia and Qatar pursue tourism diversification objectives, often granting subsidized land and infrastructure that lower breakeven traffic thresholds. For private operators, joint ventures with state entities offer accelerated permits and capital sharing, but also expose them to political objectives beyond commercial ROI.
Independent family-owned parks, while effective in local branding, face challenges in securing sufficient capital due to the accelerating pace of technological advancements. Larger consolidators, such as Cedar Fair and Six Flags, utilize their economies of scale to negotiate cost advantages with suppliers and distribute digital investments across extensive networks. This dynamic creates a dual structure within the amusement park industry. On one side, large-scale mega-projects are often financed through public funding, while on the other, smaller regional parks focus on leveraging cultural authenticity and niche themes to attract visitors. The industry’s growth strategy hinges on balancing these contrasting approaches to meet evolving consumer demands and technological trends.
Note: Segment shares of all individual segments available upon report purchase
Geography Analysis
North America retained 35.67% of global revenue in 2024, buoyed by concentrated IP portfolios and established travel corridors. Universal and Disney together have earmarked USD 67 billion for new Florida capacity and refurbishments, reaffirming their long-run commitment despite hurricane exposure. Canadian and Mexican properties absorb spill-over demand when currency gyrations widen purchasing-power gaps, creating cross-border arbitrage opportunities for consumers. Climate volatility, however, forces higher insurance deductibles and capital outlays for storm-hardening, compressing margins for smaller operators.
The Middle East is experiencing a robust 9.42% CAGR, driven by sovereign wealth fund investments that are expediting the development of large-scale leisure districts. Dubai leverages its position as a global transport hub to channel international layover traffic into short-stay park offerings. Abu Dhabi's introduction of branded attractions is fostering accelerated brand clustering in the region. However, the primary challenge lies in converting construction timelines into sustained international tourist inflows. Seasonal constraints, particularly the extreme summer heat, pose additional risks to maintaining consistent visitation levels.
The Asia Pacific region offers substantial untapped growth opportunities. The development of family-focused intellectual property, such as Peppa Pig and Harry Potter projects near Shanghai, reflects the increasing demand for such entertainment. In India, ventures like Wonderla Chennai highlight the expanding disposable income of the middle class. Effective market penetration requires a strong focus on localization, including adaptations in food, language, and holiday calendars. Operators achieving success in this region integrate global safety standards with culturally relevant narratives to enhance consumer engagement
Competitive Landscape
The global sector remains moderately fragmented: the five largest operators held roughly half of the amusement park market share in 2024, leaving space for region-specific players. Disney leverages an unrivalled vault of franchises and integrated resorts, underpinned by a net-zero carbon pledge, enhancing ESG credentials. Universal competes through cutting-edge media overlays and upcoming parks in Texas, Vegas, and the UK, fortifying its pipeline.
North American consolidation is visible in the Cedar Fair–Six Flags merger, expected to save USD 120 million annually by harmonising procurement and technology platforms. Merlin Entertainments scales intellectual-property partnerships with Ferrari and LEGO, translating beloved brands into global attractions. Herschend Family Entertainment’s purchase of two dozen US parks signals a renewed appetite for regional asset portfolios.
Digital transformation acts as a competitive wedge. Six Flags’ partnership with Google Cloud deploys AI chatbots and real-time pricing, while Dubai’s Global Village uses machine vision for crowd control. Sustainability further differentiates: PortAventura’s carbon-neutral milestone and Eden Project’s climate-positive ambition resonate with eco-conscious travellers. Agile adopters of technology and ESG best practices are poised to outpace laggards, sharpening rivalry within the amusement park market.
Amusement Parks Industry Leaders
-
The Walt Disney Company
-
Comcast (Universal Parks & Resorts)
-
Merlin Entertainments
-
Six Flags Entertainment Corporation
-
Cedar Fair Entertainment Company
- *Disclaimer: Major Players sorted in no particular order
Recent Industry Developments
- April 2025: Universal confirmed a multi-land amusement resort in Bedford, UK, slated to open in 2031 after construction begins in 2026.
- March 2025: Herschend Family Entertainment acquired 20+ US properties from Parques Reunidos, expanding its Dollywood-centric portfolio.
- February 2025: Disney reported record revenue in its experiences division, reinforcing parks as the company’s highest-earning segment.
- January 2025: Shanghai unveiled plans to rebuild Jinjiang Action Park into a Harry Potter-themed destination targeting 2027 reopening.
Global Amusement Parks Market Report Scope
The amusement park is a venue that offers a variety of games and attractions, such as roller coasters and carousels, for recreational purposes. This study aims to present an in-depth examination of the amusement parks market globally. It delves into the market dynamics and upcoming trends within different segments and regional markets, as well as provides insights into the diverse product and application categories. Furthermore, it evaluates the major players in the industry and the competitive environment.
The amusement parks market is segmented by theme, age group, revenue source, and geography. By theme, the market is segmented into water theme, adventure theme, and other themes, which include educational, cultural, and others. By age group, the market is segmented into up to 10 years, 11 to 18 years, 19 to 35 years, 36 to 50 years, and more than 51 years. By revenue source, the market is segmented as tickets, food and beverages, merchandise, hotels/resorts, and other revenue sources, which include parking, VIP tours, front-of-line passes, or exclusive access to specific attractions. By geography, the market is segmented into North America, Europe, Asia-Pacific, South America, and the Middle East and Africa. The market size and forecasts are provided in terms of value (USD) for all the above segments.
| By Park Type | Theme Parks | |||
| Water Parks | ||||
| Adventure / Thrill Parks | ||||
| Edutainment & Zoo Parks | ||||
| Surf & Wave Parks | ||||
| By Ride Type | Roller Coasters | |||
| Water Rides & Slides | ||||
| Flat & Spinning Rides | ||||
| AR/VR & Immersive Dark Rides | ||||
| Free-fall & Drop Towers | ||||
| By Revenue Source | Admission / Ticketing | |||
| Food & Beverage | ||||
| Merchandise & Licensing | ||||
| Hotels, Resorts & Campgrounds | ||||
| Events, Sponsorships & Ancillary | ||||
| By Age Group | Children (0–19 years) | |||
| Adults (20–54 years) | ||||
| Senior Citizens (55+ years) | ||||
| By Ownership Model | Private-Corporate | |||
| Private-Family / Independent | ||||
| Public / Government-backed | ||||
| By Geography | North America | United States | ||
| Canada | ||||
| Mexico | ||||
| South America | Brazil | |||
| Peru | ||||
| Chile | ||||
| Argentina | ||||
| Rest of South America | ||||
| Europe | United Kingdom | |||
| Germany | ||||
| France | ||||
| Spain | ||||
| Italy | ||||
| BENELUX | ||||
| NORDICS | ||||
| Rest of Europe | ||||
| Asia-Pacific | China | |||
| India | ||||
| Japan | ||||
| South Korea | ||||
| Australia | ||||
| South-East Asia | ||||
| Rest of Asia-Pacific | ||||
| Middle East and Africa | Middle East | United Arab Emirates | ||
| Saudi Arabia | ||||
| South Africa | ||||
| Nigeria | ||||
| Rest of Middle East and Africa | ||||
| Theme Parks |
| Water Parks |
| Adventure / Thrill Parks |
| Edutainment & Zoo Parks |
| Surf & Wave Parks |
| Roller Coasters |
| Water Rides & Slides |
| Flat & Spinning Rides |
| AR/VR & Immersive Dark Rides |
| Free-fall & Drop Towers |
| Admission / Ticketing |
| Food & Beverage |
| Merchandise & Licensing |
| Hotels, Resorts & Campgrounds |
| Events, Sponsorships & Ancillary |
| Children (0–19 years) |
| Adults (20–54 years) |
| Senior Citizens (55+ years) |
| Private-Corporate |
| Private-Family / Independent |
| Public / Government-backed |
| North America | United States | ||
| Canada | |||
| Mexico | |||
| South America | Brazil | ||
| Peru | |||
| Chile | |||
| Argentina | |||
| Rest of South America | |||
| Europe | United Kingdom | ||
| Germany | |||
| France | |||
| Spain | |||
| Italy | |||
| BENELUX | |||
| NORDICS | |||
| Rest of Europe | |||
| Asia-Pacific | China | ||
| India | |||
| Japan | |||
| South Korea | |||
| Australia | |||
| South-East Asia | |||
| Rest of Asia-Pacific | |||
| Middle East and Africa | Middle East | United Arab Emirates | |
| Saudi Arabia | |||
| South Africa | |||
| Nigeria | |||
| Rest of Middle East and Africa | |||
Key Questions Answered in the Report
What is the current size of the amusement park market?
The amusement park market stands at USD 80.51 billion in 2025 and is projected to reach USD 101.20 billion by 2030 on a 4.68% CAGR.
Which region is growing fastest in the amusement park market?
The Middle East leads with a 9.42% CAGR through 2030, propelled by sovereign-funded mega-projects like Saudi Arabia’s Qiddiya.
What segment is growing fastest by park type?
Water parks are the fastest-expanding category, forecast to grow at 7.36% CAGR through 2030 due to modular indoor facilities and surf-lagoon technology.
How are operators increasing revenue beyond ticket sales?
Integrated hotels, resorts, and campgrounds are rising at an 8.50% CAGR, while dynamic pricing, premium dining, and branded merchandise deepen per-capita spend.
What role does technology play in park performance?
AI-driven pricing, crowd analytics, and AR/VR attractions improve capacity utilisation, personalise experiences, and support higher guest satisfaction.
How is climate change affecting park operations?
More frequent extreme weather events drive insurance costs up and force investments in resilient infrastructure such as shaded queues and cooling zones, impacting operating margins.
Page last updated on: June 21, 2025