India Engineering Plastics Market Size
Market Overview
| Study Period | 2017 - 2029 |
| Base Year For Estimation | 2023 |
| Forecast Data Period | 2024 - 2029 |
| Market Size (2024) | USD 4.36 Billion |
| Market Size (2029) | USD 6.26 Billion |
| Growth Rate (2024 - 2029) | 7.49% CAGR |
| Market Concentration | High |
Major Players*Disclaimer: Major Players sorted in no particular order Image © Mordor Intelligence. Reuse requires attribution under CC BY 4.0. |
|

India Engineering Plastics Market Analysis
The India Engineering Plastics Market size is estimated at 4.36 billion USD in 2024, and is expected to reach 6.26 billion USD by 2029, growing at a CAGR of 7.49% during the forecast period (2024-2029).
India's engineering plastics industry is experiencing significant transformation driven by rapid industrialization and technological advancement. The sector has become increasingly important to India's manufacturing capabilities, with the electrical and electronics industry emerging as a crucial growth driver, contributing approximately 3.4% to the country's GDP. The government has implemented various initiatives to boost domestic production, including four production-linked incentive (PLI) schemes focused on smartphones, semiconductors, design, and IT hardware components, aiming to increase the industry's value to USD 17 billion. These developments are reshaping the competitive landscape and creating new opportunities for both domestic and international players.
The packaging segment has emerged as a cornerstone of the engineering plastics market, demonstrating robust growth particularly in second-tier cities. India's plastic packaging production reached a significant milestone of 4.16 million tons in 2022, reflecting the industry's strong manufacturing capabilities. The market is witnessing increased adoption of advanced manufacturing technologies and automation, with domestic and foreign firms forming strategic partnerships and joint ventures to enhance production efficiency and market presence. This transformation is particularly evident in the development of specialized packaging solutions for various industries.
The electrical and electronics sector has shown remarkable export performance, with electronic goods exports reaching USD 2,009.07 million in September 2022, marking an impressive year-over-year growth of 71.99%. This growth is supported by increasing investments in research and development, focusing on innovative applications in consumer electronics, automotive electronics, and industrial equipment. The industry is witnessing a shift towards more sophisticated performance plastics compounds that offer enhanced performance characteristics, including improved thermal stability, chemical resistance, and mechanical strength.
The industry is experiencing a significant shift towards sustainable practices and circular economy principles. Major manufacturers are investing in recycling technologies and developing eco-friendly alternatives to traditional engineering plastics. The market is seeing increased adoption of advanced materials and compounds that offer improved performance while maintaining environmental sustainability. This trend is particularly evident in the packaging and automotive sectors, where manufacturers are focusing on developing lightweight, durable, and recyclable materials that meet stringent performance requirements while addressing environmental concerns.
The plastics market in India is poised for substantial growth, driven by the expansion of the polymer market in India and the increasing demand for technical plastics in various industrial applications. The plastic industry market size in India is expanding as companies innovate to meet both domestic and international demand, reflecting the broader plastic industry growth in India.
India Engineering Plastics Market Trends
Regulatory support by the government to play key role in industry growth
- India witnessed an increase in electrical and electronics revenue by 19.6% from 2020 to 2021. The electronics manufacturing industry's production grew from a value of USD 37.1 billion in 2015-16 to USD 67.3 billion in 2020-21. However, COVID-19-related disruptions impacted the growth trajectory in 2020-21 and led to a decline in output.
- India's export of electronic goods stood at USD 2,009.07 million in September 2022, an increase of 71.99% Y-o-Y. Mobile phones, IT hardware (laptops, tablets), consumer electronics (TV and audio), industrial electronics, and auto electronics are key export products in this sector. The Ministry of Electronics & IT estimates that India's electronics industry exports are expected to reach a value of USD 120 billion by 2026. The United States is the largest importer of India's electronic exports, followed by the United Arab Emirates, accounting for 18% and 17% of the overall exports, respectively. Mobile phone exports from India find significant markets in South Asia, Africa, and the Middle East, making them key importing regions for these products.
- With the growing need for electronic goods, the government launched production-linked incentives (PLI), Manufacturing of Electronic Components and Semiconductors (SPECS), Modified Electronic Manufacturing Clusters (EMC 2.0), etc., to promote the country's electronic goods industry. The country's electronics industry is expected to reach a value of USD 300 billion by 2025-26 from USD 75 billion in 2020-21. India's electronics sector has the potential to become one of the top exporting sectors of India in the next 3-5 years due to the development and increase in the market share of the Indian business process outsourcing (BPO) industry.

OTHER KEY INDUSTRY TRENDS COVERED IN THE REPORT
- Rapid growth in civil aviation to drive aerospace component production
- Steady growth in domestic and foreign investments to propel growth
- India to remain import-dependent due to low domestic resin manufacturing capacity
- India waste management rises from 18% in 2014 to 70% in2021 with growth in polyamide recycling rate
- India had a recycling rate of 90% in 2020 with total PET waste accounting for 4.35 million tons
- Supportive government policies for electric vehicles to boost automotive production
- Evolving packaging trends to create demand for plastic packaging solutions
- Resin prices to remain influenced by crude oil prices in the international market
- The demand for PC resin is expected to reach 0.36 million tons by 2029, producing more recycled polycarbonate in the upcoming years
- India is expected to generate over 161 million tons of WEEE by 2050 which could be an opportunity for manufacturers to produce R-ABS
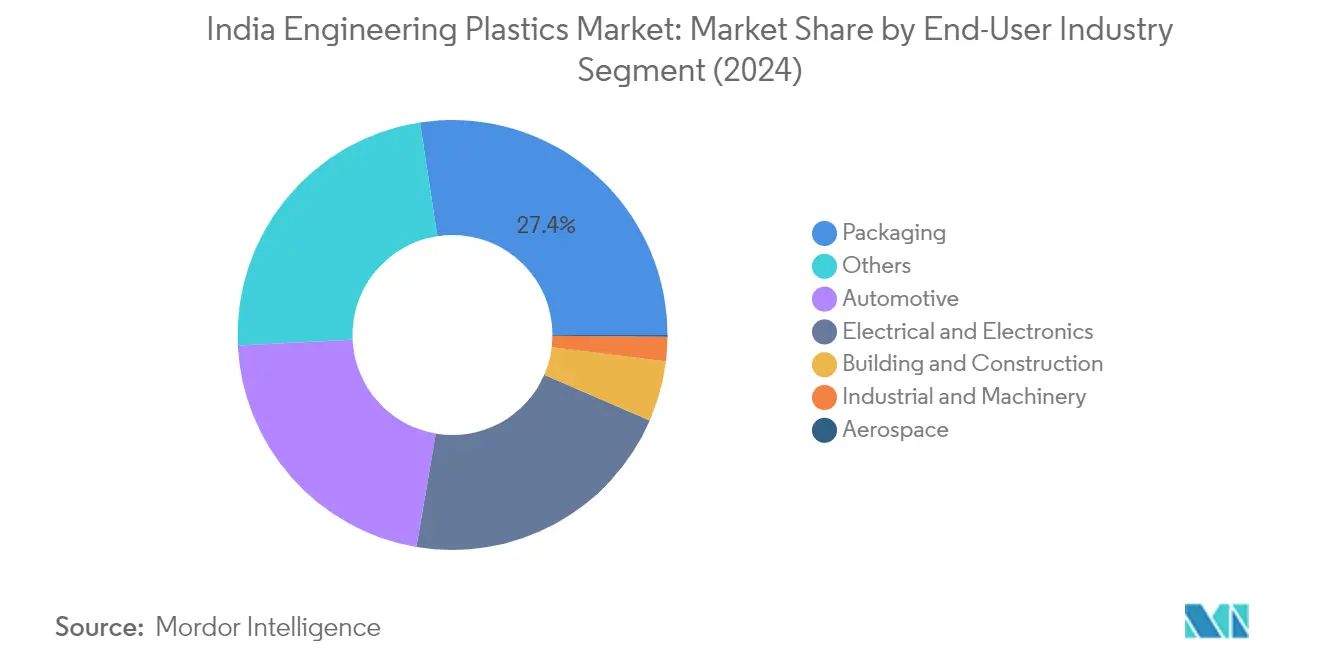
Segment Analysis: End User Industry
Packaging Segment in India Engineering Plastics Market
The packaging segment maintains its dominant position in India's engineering plastics market, accounting for approximately 27% of the total market value in 2024. This leadership position is primarily driven by the steadily increasing population, rising income levels, internet penetration, and changing lifestyles that have boosted the demand for plastic packaging in the food and beverage and pharmaceutical industries. The segment's growth is further supported by India's rapidly expanding e-commerce sector, which extensively utilizes flexible plastic packaging for convenience and efficiency during logistic operations. The preference for processed and packaged foods has significantly propelled the food packaging market in the country, while technological innovations have enabled manufacturers to use fewer natural resources while maintaining packaging effectiveness.
Electrical & Electronics Segment in India Engineering Plastics Market
The electrical and electronics segment is emerging as the fastest-growing sector in India's engineering plastics market, projected to expand at a rate of approximately 9% during 2024-2029. This remarkable growth is primarily attributed to the rising trend of smart offices and smart homes, which is augmenting the demand for various consumer electronics products such as smart air conditioners, smart refrigerators, and smart TVs. The government's initiatives like the 'Make in India' policy and production-linked incentive (PLI) schemes for electronics manufacturing are significantly boosting domestic production and foreign investments in the nation. The electronics industry is expected to reach a market value of USD 300 billion by 2026, creating substantial opportunities for engineering plastics in applications ranging from appliance insulation to small household appliances.
Remaining Segments in End User Industry
The other significant segments in India's engineering plastics market include automotive plastics, building and construction, industrial and machinery, and aerospace plastics sectors. The automotive sector represents a substantial share due to the increasing adoption of lightweight materials in vehicle manufacturing. The building and construction segment is driven by infrastructure development and government initiatives for affordable housing. The industrial and machinery segment benefits from the country's growing manufacturing sector, while the aerospace segment, though smaller, is witnessing steady growth due to increasing investments in defense and civil aviation infrastructure. These segments collectively contribute to the market's diverse application landscape and overall growth trajectory.
Segment Analysis: Resin Type
PET Segment in India Engineering Plastics Market
Polyethylene terephthalate (PET) continues to dominate the Indian engineering plastics market, holding approximately 26% market share in 2024. The segment's leadership position is primarily driven by its extensive applications in packaging applications, particularly in bottles and containers manufacturing. PET's popularity stems from its key properties, including recyclability, cost-effectiveness, and superior performance characteristics such as clarity, strength, and lightweight nature. The segment's growth is further supported by the rising demand from the food and beverage packaging industry, where PET remains the material of choice due to its clear, strong, lightweight, and 100% recyclable properties.
LCP Segment in India Engineering Plastics Market
The Liquid Crystal Polymer (LCP) segment is emerging as the fastest-growing segment in the Indian engineering plastics market, projected to grow at approximately 10% CAGR during 2024-2029. This remarkable growth is primarily driven by increasing adoption in the electrical and electronics industry, where LCP's exceptional properties make it ideal for various electronic components. The segment's expansion is further supported by the growing trend of miniaturization in electronics and the increasing demand for high-performance materials in telecommunications equipment. The rapid development of 5G infrastructure and the growing emphasis on advanced electronic manufacturing in India are creating substantial opportunities for LCP applications.
Remaining Segments in Resin Type
The other significant segments in the Indian engineering plastics market include polycarbonate (PC), Styrene Copolymers (ABS and SAN), polyamide (PA), and various other specialty resins. PC has established itself as a crucial material in automotive plastics and electronics applications due to its exceptional impact strength and optical clarity. ABS and SAN copolymers are widely utilized in automotive and consumer goods manufacturing owing to their excellent balance of properties. Polyamide resins serve critical applications in automotive and industrial components, while specialty resins like polymethyl methacrylate (PMMA), PEEK, and polybutylene terephthalate (PBT) cater to specific high-performance applications across various industries. The inclusion of thermoplastic compounds and reinforced plastics further enhances the versatility of these materials in meeting diverse industrial demands.
India Engineering Plastics Industry Overview
Top Companies in India Engineering Plastics Market
The leading companies in India's engineering plastic industry are demonstrating a strong commitment to innovation and market expansion through various strategic initiatives. Manufacturers are increasingly focusing on developing sustainable solutions, including bio-attributed materials and recycled content products, to meet evolving customer demands and environmental regulations. Companies are strengthening their research and development capabilities through dedicated innovation centers and collaborations with educational and research institutes to develop new products and applications. Operational excellence is being pursued through vertical integration across the value chain, from raw material sourcing to end-product manufacturing. Strategic moves include capacity expansions, particularly in PET resin production, and the establishment of new manufacturing facilities to capture growing market opportunities. Companies are also investing in advanced manufacturing technologies and automation to improve production efficiency and product quality while reducing operational costs.
Consolidated Market with Strong Local Players
The Indian engineered plastics market exhibits a highly consolidated structure dominated by both domestic conglomerates and multinational corporations. Local players like Reliance Industries Limited and IVL Dhunseri Petrochem Industries Private Limited have established strong market positions through their extensive manufacturing capabilities and well-developed distribution networks. The market is characterized by significant entry barriers due to high capital requirements, technical expertise needs, and established player relationships with key end-users. The presence of vertically integrated manufacturers who control multiple stages of the value chain further strengthens market consolidation.
The market demonstrates distinct segmentation across different resin types, with certain players holding monopolistic positions in specific segments. Joint ventures and strategic partnerships between domestic and international players have emerged as key strategies for market expansion and technology access. Companies are increasingly focusing on backward integration to secure raw material supply and maintain cost competitiveness. The competitive landscape is further shaped by the presence of specialized players focusing on specific resin types or end-user industries, complementing the broader product portfolios of larger conglomerates.
Innovation and Sustainability Drive Future Success
Success in the Indian engineering plastics market increasingly depends on companies' ability to innovate and adapt to changing market dynamics. Incumbents are strengthening their position through investments in advanced manufacturing technologies, development of specialized grades for high-value applications, and expansion of their distribution networks. Companies are also focusing on building strong relationships with key end-user industries through technical support and customized solutions. The ability to offer sustainable products and demonstrate environmental responsibility is becoming crucial for maintaining market leadership.
Market contenders can gain ground by focusing on niche applications and underserved market segments, particularly in emerging end-use industries. Success factors include developing cost-effective alternatives to existing materials, establishing strong technical service capabilities, and building strategic partnerships for technology access. Companies must also consider potential regulatory changes regarding plastic usage and recycling, which could impact market dynamics. The increasing focus on localization of supply chains presents opportunities for domestic players to expand their market presence. Building strong relationships with end-users in high-growth sectors like automotive and electronics will be crucial for long-term success. The role of engineering plastics suppliers is pivotal in ensuring a steady supply of materials that meet the evolving demands of these sectors.
India Engineering Plastics Market Leaders
-
Chiripal Poly Film
-
INEOS
-
IVL Dhunseri Petrochem Industries Private Limited (IDPIPL)
-
JBF Industries Ltd
-
Reliance Industries Limited
- *Disclaimer: Major Players sorted in no particular order

India Engineering Plastics Market News
- September 2022: LANXESS introduced a sustainable polyamide resin, Durethan ECO, which consists of recycled fibers made from waste glass to reduce its carbon footprint.
- September 2022: LANXESS introduced Pocan E, a new polybutylene terephthalate (PBT) compound with excellent tracking resistance that is particularly suited to applications in e-mobility and the electrical and electronics industry.
- August 2022: INEOS announced the introduction of an extension to its high-performance Novodur line of specialty ABS products. The new Novodur E3TZ is an extrusion grade that is suitable for a variety of applications, including food trays, sanitary applications, and suitcases.
Free With This Report
We provide a complimentary and exhaustive set of data points on global and regional metrics that present the fundamental structure of the industry. Presented in the form of 15+ free charts, the section covers rare data on various end-user production trends including passenger vehicle production, commercial vehicle production, motorcycle production, aerospace components production, electrical and electronics production, and regional data for engineering plastics demand etc.


List of Tables & Figures
- Figure 1:
- PRODUCTION REVENUE OF AEROSPACE COMPONENTS, USD, INDIA, 2017 - 2029
- Figure 2:
- PRODUCTION VOLUME OF AUTOMOBILES, UNITS, INDIA, 2017 - 2029
- Figure 3:
- FLOOR AREA OF NEW CONSTRUCTION, SQUARE FEET, INDIA, 2017 - 2029
- Figure 4:
- PRODUCTION REVENUE OF ELECTRICAL AND ELECTRONICS, USD, INDIA, 2017 - 2029
- Figure 5:
- PRODUCTION VOLUME OF PLASTIC PACKAGING, TONS, INDIA, 2017 - 2029
- Figure 6:
- IMPORT REVENUE OF ENGINEERING PLASTICS BY RESIN TYPE, USD, INDIA, 2017 - 2021
- Figure 7:
- EXPORT REVENUE OF ENGINEERING PLASTICS BY RESIN TYPE, USD, INDIA, 2017 - 2021
- Figure 8:
- PRICE OF ENGINEERING PLASTICS BY RESIN TYPE, USD PER KG, INDIA, 2017 - 2021
- Figure 9:
- VOLUME OF ENGINEERING PLASTICS CONSUMED, TONS, INDIA, 2017 - 2029
- Figure 10:
- VALUE OF ENGINEERING PLASTICS CONSUMED, USD, INDIA, 2017 - 2029
- Figure 11:
- VOLUME OF ENGINEERING PLASTICS CONSUMED BY END USER INDUSTRY, TONS, INDIA, 2017 - 2029
- Figure 12:
- VALUE OF ENGINEERING PLASTICS CONSUMED BY END USER INDUSTRY, USD, INDIA, 2017 - 2029
- Figure 13:
- VOLUME SHARE OF ENGINEERING PLASTICS CONSUMED BY END USER INDUSTRY, %, INDIA, 2017, 2023, AND 2029
- Figure 14:
- VALUE SHARE OF ENGINEERING PLASTICS CONSUMED BY END USER INDUSTRY, %, INDIA, 2017, 2023, AND 2029
- Figure 15:
- VOLUME OF ENGINEERING PLASTICS CONSUMED IN AEROSPACE INDUSTRY, TONS, INDIA, 2017 - 2029
- Figure 16:
- VALUE OF ENGINEERING PLASTICS CONSUMED IN AEROSPACE INDUSTRY, USD, INDIA, 2017 - 2029
- Figure 17:
- VALUE SHARE OF ENGINEERING PLASTICS CONSUMED IN AEROSPACE INDUSTRY BY RESIN TYPE, %, INDIA, 2022 VS 2029
- Figure 18:
- VOLUME OF ENGINEERING PLASTICS CONSUMED IN AUTOMOTIVE INDUSTRY, TONS, INDIA, 2017 - 2029
- Figure 19:
- VALUE OF ENGINEERING PLASTICS CONSUMED IN AUTOMOTIVE INDUSTRY, USD, INDIA, 2017 - 2029
- Figure 20:
- VALUE SHARE OF ENGINEERING PLASTICS CONSUMED IN AUTOMOTIVE INDUSTRY BY RESIN TYPE, %, INDIA, 2022 VS 2029
- Figure 21:
- VOLUME OF ENGINEERING PLASTICS CONSUMED IN BUILDING AND CONSTRUCTION INDUSTRY, TONS, INDIA, 2017 - 2029
- Figure 22:
- VALUE OF ENGINEERING PLASTICS CONSUMED IN BUILDING AND CONSTRUCTION INDUSTRY, USD, INDIA, 2017 - 2029
- Figure 23:
- VALUE SHARE OF ENGINEERING PLASTICS CONSUMED IN BUILDING AND CONSTRUCTION INDUSTRY BY RESIN TYPE, %, INDIA, 2022 VS 2029
- Figure 24:
- VOLUME OF ENGINEERING PLASTICS CONSUMED IN ELECTRICAL AND ELECTRONICS INDUSTRY, TONS, INDIA, 2017 - 2029
- Figure 25:
- VALUE OF ENGINEERING PLASTICS CONSUMED IN ELECTRICAL AND ELECTRONICS INDUSTRY, USD, INDIA, 2017 - 2029
- Figure 26:
- VALUE SHARE OF ENGINEERING PLASTICS CONSUMED IN ELECTRICAL AND ELECTRONICS INDUSTRY BY RESIN TYPE, %, INDIA, 2022 VS 2029
- Figure 27:
- VOLUME OF ENGINEERING PLASTICS CONSUMED IN INDUSTRIAL AND MACHINERY INDUSTRY, TONS, INDIA, 2017 - 2029
- Figure 28:
- VALUE OF ENGINEERING PLASTICS CONSUMED IN INDUSTRIAL AND MACHINERY INDUSTRY, USD, INDIA, 2017 - 2029
- Figure 29:
- VALUE SHARE OF ENGINEERING PLASTICS CONSUMED IN INDUSTRIAL AND MACHINERY INDUSTRY BY RESIN TYPE, %, INDIA, 2022 VS 2029
- Figure 30:
- VOLUME OF ENGINEERING PLASTICS CONSUMED IN PACKAGING INDUSTRY, TONS, INDIA, 2017 - 2029
- Figure 31:
- VALUE OF ENGINEERING PLASTICS CONSUMED IN PACKAGING INDUSTRY, USD, INDIA, 2017 - 2029
- Figure 32:
- VALUE SHARE OF ENGINEERING PLASTICS CONSUMED IN PACKAGING INDUSTRY BY RESIN TYPE, %, INDIA, 2022 VS 2029
- Figure 33:
- VOLUME OF ENGINEERING PLASTICS CONSUMED IN OTHER END-USER INDUSTRIES INDUSTRY, TONS, INDIA, 2017 - 2029
- Figure 34:
- VALUE OF ENGINEERING PLASTICS CONSUMED IN OTHER END-USER INDUSTRIES INDUSTRY, USD, INDIA, 2017 - 2029
- Figure 35:
- VALUE SHARE OF ENGINEERING PLASTICS CONSUMED IN OTHER END-USER INDUSTRIES INDUSTRY BY RESIN TYPE, %, INDIA, 2022 VS 2029
- Figure 36:
- VOLUME OF ENGINEERING PLASTICS CONSUMED BY RESIN TYPE, TONS, INDIA, 2017 - 2029
- Figure 37:
- VALUE OF ENGINEERING PLASTICS CONSUMED BY RESIN TYPE, USD, INDIA, 2017 - 2029
- Figure 38:
- VOLUME SHARE OF ENGINEERING PLASTICS CONSUMED BY RESIN TYPE, %, INDIA, 2017, 2023, AND 2029
- Figure 39:
- VALUE SHARE OF ENGINEERING PLASTICS CONSUMED BY RESIN TYPE, %, INDIA, 2017, 2023, AND 2029
- Figure 40:
- VOLUME OF FLUOROPOLYMER CONSUMED BY SUB RESIN TYPE, TONS, INDIA, 2017 - 2029
- Figure 41:
- VALUE OF FLUOROPOLYMER CONSUMED BY SUB RESIN TYPE, USD, INDIA, 2017 - 2029
- Figure 42:
- VOLUME SHARE OF FLUOROPOLYMER CONSUMED BY SUB RESIN TYPE, %, INDIA, 2017, 2023, AND 2029
- Figure 43:
- VALUE SHARE OF FLUOROPOLYMER CONSUMED BY SUB RESIN TYPE, %, INDIA, 2017, 2023, AND 2029
- Figure 44:
- VOLUME OF ETHYLENETETRAFLUOROETHYLENE (ETFE) CONSUMED, TONS, INDIA, 2017 - 2029
- Figure 45:
- VALUE OF ETHYLENETETRAFLUOROETHYLENE (ETFE) CONSUMED, USD, INDIA, 2017 - 2029
- Figure 46:
- VALUE SHARE OF ETHYLENETETRAFLUOROETHYLENE (ETFE) CONSUMED BY END USER INDUSTRY, %, INDIA, 2022 VS 2029
- Figure 47:
- VOLUME OF FLUORINATED ETHYLENE-PROPYLENE (FEP) CONSUMED, TONS, INDIA, 2017 - 2029
- Figure 48:
- VALUE OF FLUORINATED ETHYLENE-PROPYLENE (FEP) CONSUMED, USD, INDIA, 2017 - 2029
- Figure 49:
- VALUE SHARE OF FLUORINATED ETHYLENE-PROPYLENE (FEP) CONSUMED BY END USER INDUSTRY, %, INDIA, 2022 VS 2029
- Figure 50:
- VOLUME OF POLYTETRAFLUOROETHYLENE (PTFE) CONSUMED, TONS, INDIA, 2017 - 2029
- Figure 51:
- VALUE OF POLYTETRAFLUOROETHYLENE (PTFE) CONSUMED, USD, INDIA, 2017 - 2029
- Figure 52:
- VALUE SHARE OF POLYTETRAFLUOROETHYLENE (PTFE) CONSUMED BY END USER INDUSTRY, %, INDIA, 2022 VS 2029
- Figure 53:
- VOLUME OF POLYVINYLFLUORIDE (PVF) CONSUMED, TONS, INDIA, 2017 - 2029
- Figure 54:
- VALUE OF POLYVINYLFLUORIDE (PVF) CONSUMED, USD, INDIA, 2017 - 2029
- Figure 55:
- VALUE SHARE OF POLYVINYLFLUORIDE (PVF) CONSUMED BY END USER INDUSTRY, %, INDIA, 2022 VS 2029
- Figure 56:
- VOLUME OF POLYVINYLIDENE FLUORIDE (PVDF) CONSUMED, TONS, INDIA, 2017 - 2029
- Figure 57:
- VALUE OF POLYVINYLIDENE FLUORIDE (PVDF) CONSUMED, USD, INDIA, 2017 - 2029
- Figure 58:
- VALUE SHARE OF POLYVINYLIDENE FLUORIDE (PVDF) CONSUMED BY END USER INDUSTRY, %, INDIA, 2022 VS 2029
- Figure 59:
- VOLUME OF OTHER SUB RESIN TYPES CONSUMED, TONS, INDIA, 2017 - 2029
- Figure 60:
- VALUE OF OTHER SUB RESIN TYPES CONSUMED, USD, INDIA, 2017 - 2029
- Figure 61:
- VALUE SHARE OF OTHER SUB RESIN TYPES CONSUMED BY END USER INDUSTRY, %, INDIA, 2022 VS 2029
- Figure 62:
- VOLUME OF LIQUID CRYSTAL POLYMER (LCP) CONSUMED, TONS, INDIA, 2017 - 2029
- Figure 63:
- VALUE OF LIQUID CRYSTAL POLYMER (LCP) CONSUMED, USD, INDIA, 2017 - 2029
- Figure 64:
- VALUE SHARE OF LIQUID CRYSTAL POLYMER (LCP) CONSUMED BY END USER INDUSTRY, %, INDIA, 2022 VS 2029
- Figure 65:
- VOLUME OF POLYAMIDE (PA) CONSUMED BY SUB RESIN TYPE, TONS, INDIA, 2017 - 2029
- Figure 66:
- VALUE OF POLYAMIDE (PA) CONSUMED BY SUB RESIN TYPE, USD, INDIA, 2017 - 2029
- Figure 67:
- VOLUME SHARE OF POLYAMIDE (PA) CONSUMED BY SUB RESIN TYPE, %, INDIA, 2017, 2023, AND 2029
- Figure 68:
- VALUE SHARE OF POLYAMIDE (PA) CONSUMED BY SUB RESIN TYPE, %, INDIA, 2017, 2023, AND 2029
- Figure 69:
- VOLUME OF ARAMID CONSUMED, TONS, INDIA, 2017 - 2029
- Figure 70:
- VALUE OF ARAMID CONSUMED, USD, INDIA, 2017 - 2029
- Figure 71:
- VALUE SHARE OF ARAMID CONSUMED BY END USER INDUSTRY, %, INDIA, 2022 VS 2029
- Figure 72:
- VOLUME OF POLYAMIDE (PA) 6 CONSUMED, TONS, INDIA, 2017 - 2029
- Figure 73:
- VALUE OF POLYAMIDE (PA) 6 CONSUMED, USD, INDIA, 2017 - 2029
- Figure 74:
- VALUE SHARE OF POLYAMIDE (PA) 6 CONSUMED BY END USER INDUSTRY, %, INDIA, 2022 VS 2029
- Figure 75:
- VOLUME OF POLYAMIDE (PA) 66 CONSUMED, TONS, INDIA, 2017 - 2029
- Figure 76:
- VALUE OF POLYAMIDE (PA) 66 CONSUMED, USD, INDIA, 2017 - 2029
- Figure 77:
- VALUE SHARE OF POLYAMIDE (PA) 66 CONSUMED BY END USER INDUSTRY, %, INDIA, 2022 VS 2029
- Figure 78:
- VOLUME OF POLYPHTHALAMIDE CONSUMED, TONS, INDIA, 2017 - 2029
- Figure 79:
- VALUE OF POLYPHTHALAMIDE CONSUMED, USD, INDIA, 2017 - 2029
- Figure 80:
- VALUE SHARE OF POLYPHTHALAMIDE CONSUMED BY END USER INDUSTRY, %, INDIA, 2022 VS 2029
- Figure 81:
- VOLUME OF POLYBUTYLENE TEREPHTHALATE (PBT) CONSUMED, TONS, INDIA, 2017 - 2029
- Figure 82:
- VALUE OF POLYBUTYLENE TEREPHTHALATE (PBT) CONSUMED, USD, INDIA, 2017 - 2029
- Figure 83:
- VALUE SHARE OF POLYBUTYLENE TEREPHTHALATE (PBT) CONSUMED BY END USER INDUSTRY, %, INDIA, 2022 VS 2029
- Figure 84:
- VOLUME OF POLYCARBONATE (PC) CONSUMED, TONS, INDIA, 2017 - 2029
- Figure 85:
- VALUE OF POLYCARBONATE (PC) CONSUMED, USD, INDIA, 2017 - 2029
- Figure 86:
- VALUE SHARE OF POLYCARBONATE (PC) CONSUMED BY END USER INDUSTRY, %, INDIA, 2022 VS 2029
- Figure 87:
- VOLUME OF POLYETHER ETHER KETONE (PEEK) CONSUMED, TONS, INDIA, 2017 - 2029
- Figure 88:
- VALUE OF POLYETHER ETHER KETONE (PEEK) CONSUMED, USD, INDIA, 2017 - 2029
- Figure 89:
- VALUE SHARE OF POLYETHER ETHER KETONE (PEEK) CONSUMED BY END USER INDUSTRY, %, INDIA, 2022 VS 2029
- Figure 90:
- VOLUME OF POLYETHYLENE TEREPHTHALATE (PET) CONSUMED, TONS, INDIA, 2017 - 2029
- Figure 91:
- VALUE OF POLYETHYLENE TEREPHTHALATE (PET) CONSUMED, USD, INDIA, 2017 - 2029
- Figure 92:
- VALUE SHARE OF POLYETHYLENE TEREPHTHALATE (PET) CONSUMED BY END USER INDUSTRY, %, INDIA, 2022 VS 2029
- Figure 93:
- VOLUME OF POLYIMIDE (PI) CONSUMED, TONS, INDIA, 2017 - 2029
- Figure 94:
- VALUE OF POLYIMIDE (PI) CONSUMED, USD, INDIA, 2017 - 2029
- Figure 95:
- VALUE SHARE OF POLYIMIDE (PI) CONSUMED BY END USER INDUSTRY, %, INDIA, 2022 VS 2029
- Figure 96:
- VOLUME OF POLYMETHYL METHACRYLATE (PMMA) CONSUMED, TONS, INDIA, 2017 - 2029
- Figure 97:
- VALUE OF POLYMETHYL METHACRYLATE (PMMA) CONSUMED, USD, INDIA, 2017 - 2029
- Figure 98:
- VALUE SHARE OF POLYMETHYL METHACRYLATE (PMMA) CONSUMED BY END USER INDUSTRY, %, INDIA, 2022 VS 2029
- Figure 99:
- VOLUME OF POLYOXYMETHYLENE (POM) CONSUMED, TONS, INDIA, 2017 - 2029
- Figure 100:
- VALUE OF POLYOXYMETHYLENE (POM) CONSUMED, USD, INDIA, 2017 - 2029
- Figure 101:
- VALUE SHARE OF POLYOXYMETHYLENE (POM) CONSUMED BY END USER INDUSTRY, %, INDIA, 2022 VS 2029
- Figure 102:
- VOLUME OF STYRENE COPOLYMERS (ABS AND SAN) CONSUMED, TONS, INDIA, 2017 - 2029
- Figure 103:
- VALUE OF STYRENE COPOLYMERS (ABS AND SAN) CONSUMED, USD, INDIA, 2017 - 2029
- Figure 104:
- VALUE SHARE OF STYRENE COPOLYMERS (ABS AND SAN) CONSUMED BY END USER INDUSTRY, %, INDIA, 2022 VS 2029
- Figure 105:
- MOST ACTIVE COMPANIES BY NUMBER OF STRATEGIC MOVES, INDIA, 2019 - 2021
- Figure 106:
- MOST ADOPTED STRATEGIES, COUNT, INDIA, 2019 - 2021
- Figure 107:
- PRODUCTION CAPACITY SHARE OF ENGINEERING PLASTICS BY MAJOR PLAYERS, %, INDIA, 2022
- Figure 108:
- PRODUCTION CAPACITY SHARE OF FLUOROPOLYMER BY MAJOR PLAYERS, %, INDIA, 2022
- Figure 109:
- PRODUCTION CAPACITY SHARE OF POLYAMIDE (PA) BY MAJOR PLAYERS, %, INDIA, 2022
- Figure 110:
- PRODUCTION CAPACITY SHARE OF POLYBUTYLENE TEREPHTHALATE (PBT) BY MAJOR PLAYERS, %, INDIA, 2022
- Figure 111:
- PRODUCTION CAPACITY SHARE OF POLYETHER ETHER KETONE (PEEK) BY MAJOR PLAYERS, %, INDIA, 2022
- Figure 112:
- PRODUCTION CAPACITY SHARE OF POLYETHYLENE TEREPHTHALATE (PET) BY MAJOR PLAYERS, %, INDIA, 2022
- Figure 113:
- PRODUCTION CAPACITY SHARE OF STYRENE COPOLYMERS (ABS AND SAN) BY MAJOR PLAYERS, %, INDIA, 2022
India Engineering Plastics Industry Segmentation
Aerospace, Automotive, Building and Construction, Electrical and Electronics, Industrial and Machinery, Packaging are covered as segments by End User Industry. Fluoropolymer, Liquid Crystal Polymer (LCP), Polyamide (PA), Polybutylene Terephthalate (PBT), Polycarbonate (PC), Polyether Ether Ketone (PEEK), Polyethylene Terephthalate (PET), Polyimide (PI), Polymethyl Methacrylate (PMMA), Polyoxymethylene (POM), Styrene Copolymers (ABS and SAN) are covered as segments by Resin Type.| End User Industry | Aerospace | |||
| Automotive | ||||
| Building and Construction | ||||
| Electrical and Electronics | ||||
| Industrial and Machinery | ||||
| Packaging | ||||
| Other End-user Industries | ||||
| Resin Type | Fluoropolymer | By Sub Resin Type | Ethylenetetrafluoroethylene (ETFE) | |
| Fluorinated Ethylene-propylene (FEP) | ||||
| Polytetrafluoroethylene (PTFE) | ||||
| Polyvinylfluoride (PVF) | ||||
| Polyvinylidene Fluoride (PVDF) | ||||
| Other Sub Resin Types | ||||
| Liquid Crystal Polymer (LCP) | ||||
| Polyamide (PA) | By Sub Resin Type | Aramid | ||
| Polyamide (PA) 6 | ||||
| Polyamide (PA) 66 | ||||
| Polyphthalamide | ||||
| Polybutylene Terephthalate (PBT) | ||||
| Polycarbonate (PC) | ||||
| Polyether Ether Ketone (PEEK) | ||||
| Polyethylene Terephthalate (PET) | ||||
| Polyimide (PI) | ||||
| Polymethyl Methacrylate (PMMA) | ||||
| Polyoxymethylene (POM) | ||||
| Styrene Copolymers (ABS and SAN) | ||||
| Aerospace |
| Automotive |
| Building and Construction |
| Electrical and Electronics |
| Industrial and Machinery |
| Packaging |
| Other End-user Industries |
| Fluoropolymer | By Sub Resin Type | Ethylenetetrafluoroethylene (ETFE) |
| Fluorinated Ethylene-propylene (FEP) | ||
| Polytetrafluoroethylene (PTFE) | ||
| Polyvinylfluoride (PVF) | ||
| Polyvinylidene Fluoride (PVDF) | ||
| Other Sub Resin Types | ||
| Liquid Crystal Polymer (LCP) | ||
| Polyamide (PA) | By Sub Resin Type | Aramid |
| Polyamide (PA) 6 | ||
| Polyamide (PA) 66 | ||
| Polyphthalamide | ||
| Polybutylene Terephthalate (PBT) | ||
| Polycarbonate (PC) | ||
| Polyether Ether Ketone (PEEK) | ||
| Polyethylene Terephthalate (PET) | ||
| Polyimide (PI) | ||
| Polymethyl Methacrylate (PMMA) | ||
| Polyoxymethylene (POM) | ||
| Styrene Copolymers (ABS and SAN) |
Market Definition
- End-user Industry - Packaging, Electrical & Electronics, Automotive, Building & Construction, and Others are the end-user industries considered under the engineering plastics market.
- Resin - Under the scope of the study, consumption of virgin resins like Fluoropolymer, Polycarbonate, Polyethylene Terephthalate, Polybutylene Terephthalate, Polyoxymethylene, Polymethyl Methacrylate, Styrene Copolymers, Liquid Crystal Polymer, Polyether Ether Ketone, Polyimide, and Polyamide in the primary forms are considered. Recycling has been provided separately under its individual chapter.
| Keyword | Definition |
|---|---|
| Acetal | This is a rigid material that has a slippery surface. It can easily withstand wear and tear in abusive work environments. This polymer is used for building applications such as gears, bearings, valve components, etc. |
| Acrylic | This synthetic resin is a derivative of acrylic acid. It forms a smooth surface and is mainly used for various indoor applications. The material can also be used for outdoor applications with a special formulation. |
| Cast film | A cast film is made by depositing a layer of plastic onto a surface then solidifying and removing the film from that surface. The plastic layer can be in molten form, in a solution, or in dispersion. |
| Colorants & Pigments | Colorants & Pigments are additives used to change the color of the plastic. They can be a powder or a resin/color premix. |
| Composite material | A composite material is a material that is produced from two or more constituent materials. These constituent materials have dissimilar chemical or physical properties and are merged to create a material with properties unlike the individual elements. |
| Degree of Polymerization (DP) | The number of monomeric units in a macromolecule, polymer, or oligomer molecule is referred to as the degree of polymerization or DP. Plastics with useful physical properties often have DPs in the thousands. |
| Dispersion | To create a suspension or solution of material in another substance, fine, agglomerated solid particles of one substance are dispersed in a liquid or another substance to form a dispersion. |
| Fiberglass | Fiberglass-reinforced plastic is a material made up of glass fibers embedded in a resin matrix. These materials have high tensile and impact strength. Handrails and platforms are two examples of lightweight structural applications that use standard fiberglass. |
| Fiber-reinforced polymer (FRP) | Fiber-reinforced polymer is a composite material made of a polymer matrix reinforced with fibers. The fibers are usually glass, carbon, aramid, or basalt. |
| Flake | This is a dry, peeled-off piece, usually with an uneven surface, and is the base of cellulosic plastics. |
| Fluoropolymers | This is a fluorocarbon-based polymer with multiple carbon-fluorine bonds. It is characterized by high resistance to solvents, acids, and bases. These materials are tough yet easy to machine. Some of the popular fluoropolymers are PTFE, ETFE, PVDF, PVF, etc. |
| Kevlar | Kevlar is the commonly referred name for aramid fiber, which was initially a Dupont brand for aramid fiber. Any group of lightweight, heat-resistant, solid, synthetic, aromatic polyamide materials that are fashioned into fibers, filaments, or sheets is called aramid fiber. They are classified into Para-aramid and Meta-aramid. |
| Laminate | A structure or surface composed of sequential layers of material bonded under pressure and heat to build up to the desired shape and width. |
| Nylon | They are synthetic fiber-forming polyamides formed into yarns and monofilaments. These fibers possess excellent tensile strength, durability, and elasticity. They have high melting points and can resist chemicals and various liquids. |
| PET preform | A preform is an intermediate product that is subsequently blown into a polyethylene terephthalate (PET) bottle or a container. |
| Plastic compounding | Compounding consists of preparing plastic formulations by mixing and/or blending polymers and additives in a molten state to achieve the desired characteristics. These blends are automatically dosed with fixed setpoints usually through feeders/hoppers. |
| Plastic pellets | Plastic pellets, also known as pre-production pellets or nurdles, are the building blocks for nearly every product made of plastic. |
| Polymerization | It is a chemical reaction of several monomer molecules to form polymer chains that form stable covalent bonds. |
| Styrene Copolymers | A copolymer is a polymer derived from more than one species of monomer, and a styrene copolymer is a chain of polymers consisting of styrene and acrylate. |
| Thermoplastics | Thermoplastics are defined as polymers that become soft material when it is heated and becomes hard when it is cooled. Thermoplastics have wide-ranging properties and can be remolded and recycled without affecting their physical properties. |
| Virgin Plastic | It is a basic form of plastic that has never been used, processed, or developed. It may be considered more valuable than recycled or already used materials. |
Research Methodology
Mordor Intelligence follows a four-step methodology in all our reports.
- Step-1: Identify Key Variables: The quantifiable key variables (industry and extraneous) pertaining to the specific product segment and country are selected from a group of relevant variables & factors based on desk research & literature review; along with primary expert inputs. These variables are further confirmed through regression modeling (wherever required).
- Step-2: Build a Market Model: In order to build a robust forecasting methodology, the variables and factors identified in Step-1 are tested against available historical market numbers. Through an iterative process, the variables required for market forecast are set and the model is built on the basis of these variables.
- Step-3: Validate and Finalize: In this important step, all market numbers, variables and analyst calls are validated through an extensive network of primary research experts from the market studied. The respondents are selected across levels and functions to generate a holistic picture of the market studied.
- Step-4: Research Outputs: Syndicated Reports, Custom Consulting Assignments, Databases & Subscription Platforms