Industrial Water Treatment Chemicals Market Size and Share
Market Overview
| Study Period | 2019 - 2030 |
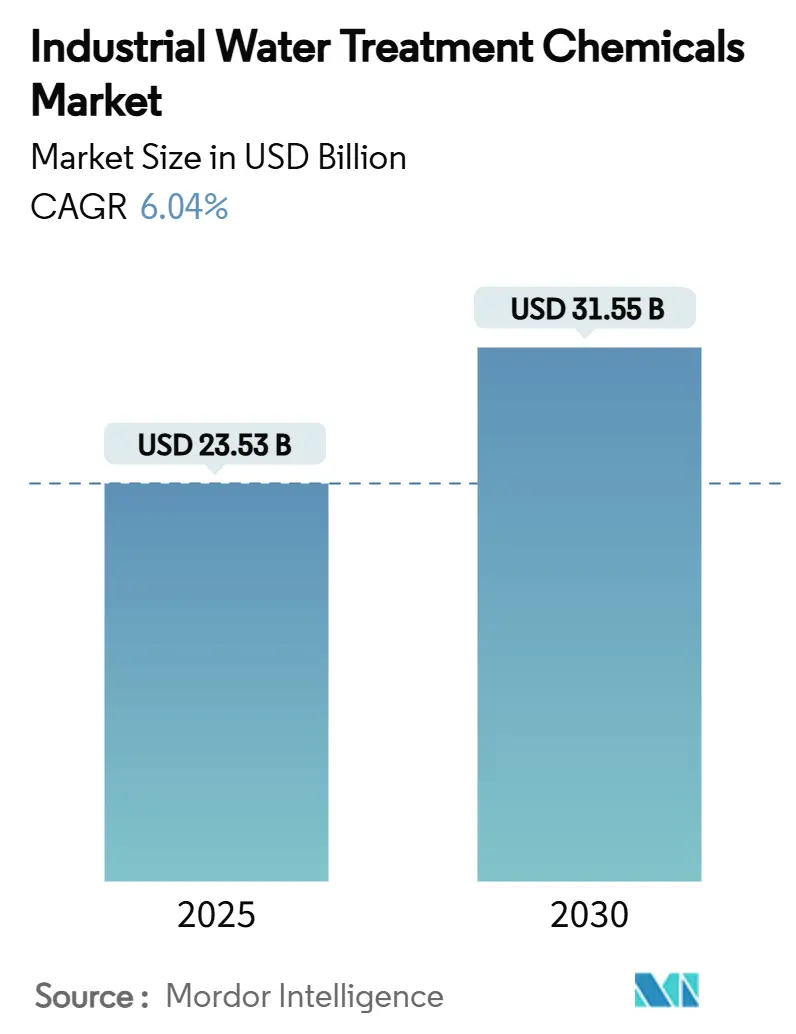
| Market Size (2025) | USD 23.53 Billion |
| Market Size (2030) | USD 31.55 Billion |
| Growth Rate (2025 - 2030) | 6.04% CAGR |
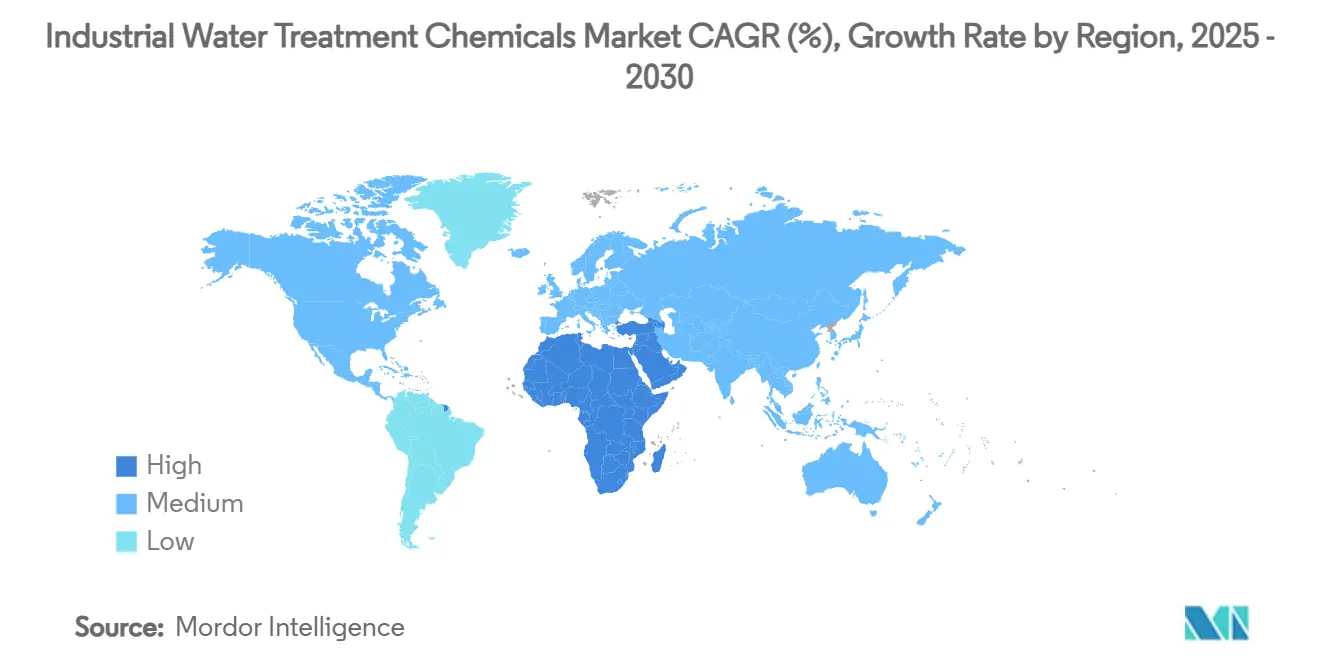
| Fastest Growing Market | Middle East and Africa |
| Largest Market | Asia Pacific |
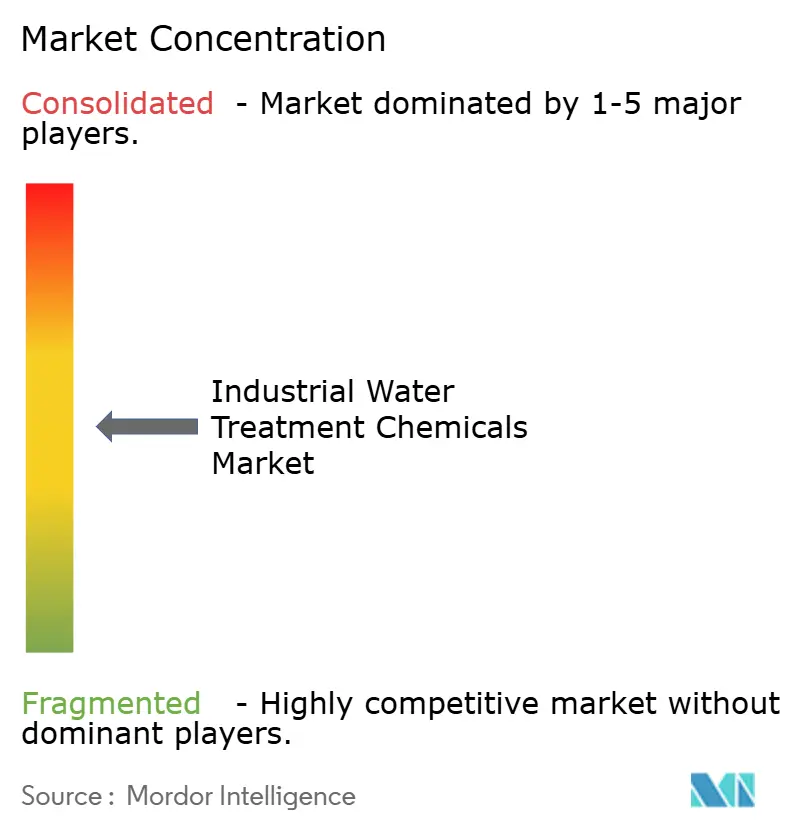
| Market Concentration | Medium |
Major Players
*Disclaimer: Major Players sorted in no particular order Image © Mordor Intelligence. Reuse requires attribution under CC BY 4.0. |
|
Industrial Water Treatment Chemicals Market Analysis by Mordor Intelligence
The Industrial Water Treatment Chemicals Market size is estimated at USD 23.53 billion in 2025, and is expected to reach USD 31.55 billion by 2030, at a CAGR of 6.04% during the forecast period (2025-2030). Growth draws strength from tightening PFAS removal mandates, expansion of shale gas operations that swell produced-water volumes, and rising industrial water-reuse targets in arid regions. Suppliers are pivoting from disposal-oriented solutions toward resource-recovery models that pair advanced chemistries with AI-enabled dosing platforms. The power sector continues to anchor demand, while biocides and disinfectants outpace the broader industrial water treatment chemicals market as industrial microbiological control becomes mission-critical. Competitive dynamics are intensifying as full-service models—combining digital monitoring, specialty chemicals, and equipment—replace commodity chemical contracts.
Key Report Takeaways
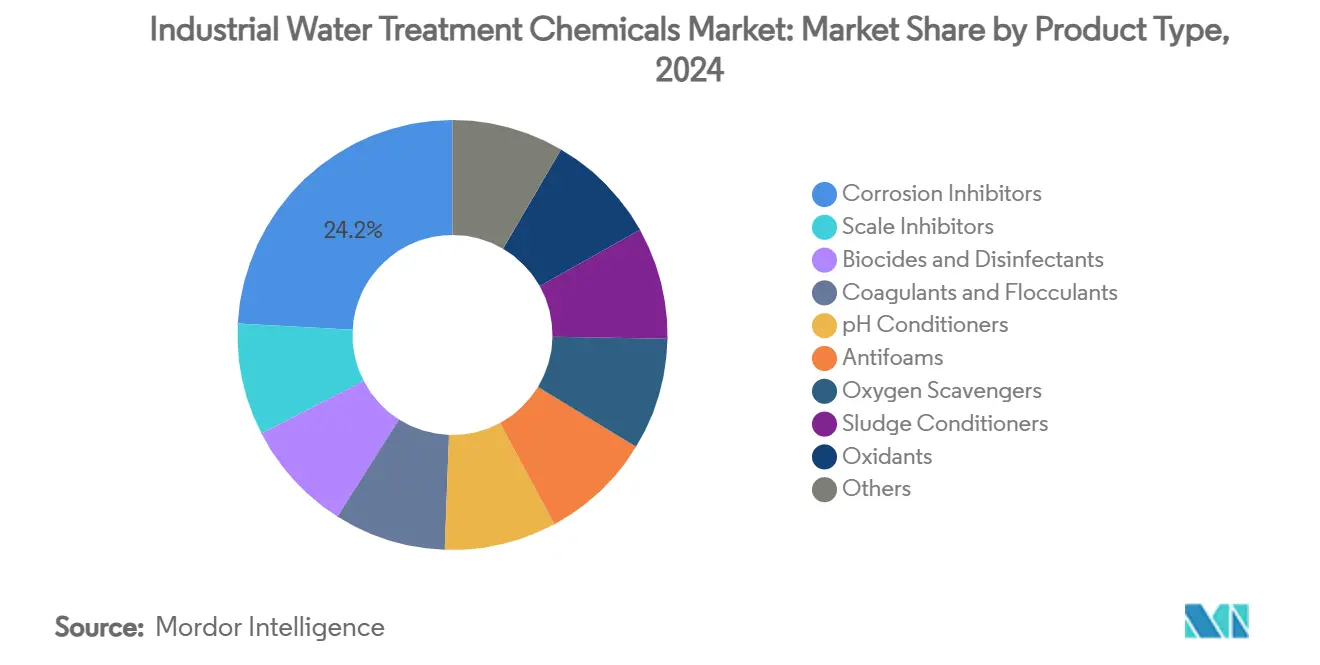
- By product type, corrosion inhibitors led with 24.16% of industrial water treatment chemicals market share in 2024; biocides and disinfectants are projected to expand at a 6.83% CAGR to 2030.
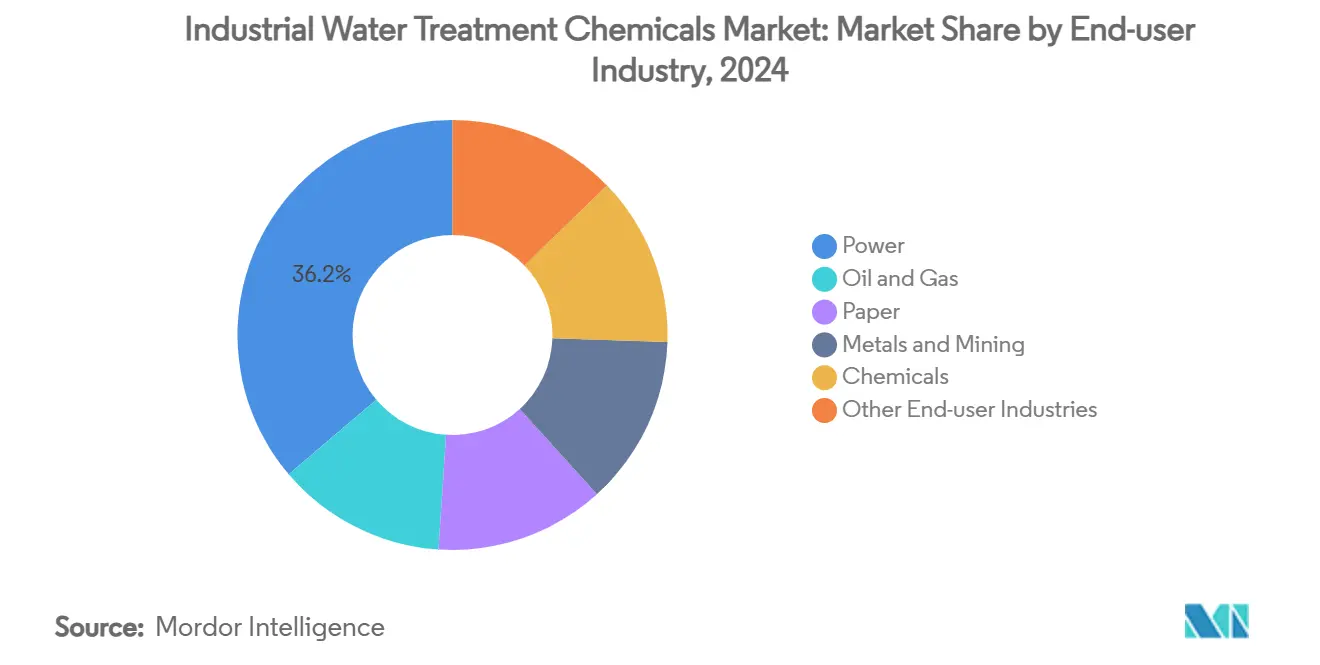
- By end-user industry, the power segment held 36.21% share of the industrial water treatment chemicals market size in 2024, while oil and gas is the fastest growing at a 6.71% CAGR through 2030.
- By geography, Asia-Pacific commanded 37.58% revenue share in 2024, whereas the Middle East and Africa region is advancing at a 7.12% CAGR to 2030.
Global Industrial Water Treatment Chemicals Market Trends and Insights
Driver Impact Analysis
| Driver | (~) % Impact on CAGR Forecast | Geographic Relevance | Impact Timeline |
|---|---|---|---|
| Rising shale gas–generated produced-water volumes (US) | +1.2% | North America, with spillover to global technology adoption | Medium term (2-4 years) |
| Growth in chemical & pulp-and-paper wastewater generation | +0.8% | Global, with early gains in Asia-Pacific and North America | Long term (≥ 4 years) |
| Tightening discharge norms for heavy metals & COD | +1.5% | Global, with strictest enforcement in North America and Europe | Short term (≤ 2 years) |
| Industrial water-re-use mandates in water-scarce regions | +1.1% | APAC core, Middle East & Africa, with expansion to Latin America | Medium term (2-4 years) |
| PFAS removal requirements in industrial effluents | +1.3% | Global, with North America and Europe driving initial compliance | Short term (≤ 2 years) |
Source: Mordor Intelligence
Rising shale gas produced-water volumes
Shale operations in the Permian Basin now generate millions of barrels of produced water each day, requiring sophisticated oxidants, biocides, and high-temperature coagulants for safe recycling or disposal. The resulting chemical demand is compounded by operator targets to recycle up to 90% of flowback water, as this lowers freshwater intake and disposal fees. Suppliers that formulate corrosion-resistant blends capable of handling 140 °C temperatures and total dissolved solids beyond 150,000 mg/L secure premium pricing. Increasingly, field deployments layer AI dosing platforms onto treatment skids, cutting overdosing and trimming chemical spend by 15-25% while maintaining performance. These gains establish an economic incentive that locks in higher volumes for the industrial water treatment chemicals market.
Tightening discharge norms for heavy metals and COD
The European Union’s Industrial Emissions Directive and the United States NPDES permits impose lower thresholds for cadmium, mercury, and chemical oxygen demand, forcing factories to upgrade treatment trains. Advanced organic binders paired with ferric-based coagulants capture fine particulates and dissolved metals more effectively than legacy alum solutions. When paired with real-time turbidity sensors, plants report a 35% reduction in sludge generation and a 20% drop in coagulant consumption without compromising compliance[1]Royal Society of Chemistry, “Surfactant-Enhanced Coagulation for PFAS,” rsc.org. The regulatory stick, coupled with measurable opex savings, accelerates adoption across textiles, metal finishing, and electronics segments.
Industrial water-reuse mandates in water-scarce regions
Saudi Arabia targets 100% reuse of treated municipal wastewater by 2025, supported by USD 80 billion in infrastructure funding. Similar policies in India and South Africa compel factories to close water loops. Reuse quality thresholds are stricter than discharge norms, boosting demand for multi-stage chemical programs that deliver low-turbidity, low-TDS effluent. Suppliers innovate with biodegradable corrosion inhibitors and tannin-based coagulants that sustain performance through repeated cycles, extending membrane life and lowering overall reagent loading. These offerings position the industrial water treatment chemicals market as an enabler of industrial circularity.
PFAS removal requirements in industrial effluents
EPA maximum contaminant levels of 4-10 ppt for six PFAS compounds impose immediate upgrade needs across U.S. utilities, with compliance cost estimates topping USD 50 billion. Standard alum or ferric salts remove less than 20% of long-chain PFAS, driving uptake of cationic surfactant-aided coagulation that elevates removal to 80% plus. Post-coagulation residuals load granulated activated carbon beds that require frequent reactivation chemicals, enlarging downstream opportunities. Veolia’s Delaware plant, running 42 GAC filters, illustrates the scale and complexity of chemical consumption in a PFAS-compliant setting.
Restraints Impact Analysis
| Restraint | (~) % Impact on CAGR Forecast | Geographic Relevance | Impact Timeline |
|---|---|---|---|
| Substitution by membrane & UV systems | -0.8% | Global, with faster adoption in developed markets | Medium term (2-4 years) |
| Volatile specialty-chemical raw-material prices | -0.6% | Global, with highest impact in emerging markets | Short term (≤ 2 years) |
| Net-zero roadmaps favouring chemical-free treatments | -0.4% | North America & EU primarily, expanding globally | Long term (≥ 4 years) |
Source: Mordor Intelligence
Substitution by membrane and UV systems
Ultrafiltration modules, paired with UV-LED disinfection, now achieve 93% turbidity removal with 22% less coagulant demand than conventional setups. Municipal utilities in China already operate 6.7 million m³/day of membrane-based capacity, shrinking alum and polymer volumes. Chemical suppliers respond by shifting portfolios toward anti-fouling cleaners and membrane preservatives. While overall reagent tons may drop, revenue potential remains if suppliers pivot to these higher-margin adjuncts.
Volatile specialty-chemical raw-material prices
Upward swings in ethylene oxide and isothiazolinone feedstocks erode margins across scale inhibitors and biocides. Emerging-market buyers are most price-sensitive and may defer plant upgrades during spikes. Firms hedge with backward-integration moves and bio-based alternatives, but near-term swings still create budgeting uncertainty that weighs on the industrial water treatment chemicals market.
Segment Analysis
By Product Type: corrosion inhibitors retain the revenue crown while biocides accelerate
Corrosion inhibitors captured 24.16% of the industrial water treatment chemicals market share in 2024, underscoring their central role in protecting high-pressure boilers, condensers, and pipelines. Demand is sticky because plant operators view USD 0.10 per cubic-meter treatment costs as cheap insurance against multi-million-dollar outage events. Organophosphate blends now integrate film-forming amino acids that tolerate temperature spikes above 150 °C without depositing on heat-exchange surfaces, lengthening inspection cycles. Biocides and disinfectants, though smaller today, are advancing at a 6.83% CAGR, the highest within the industrial water treatment chemicals market. Microbiologically influenced corrosion costs the oil, gas, and power sectors billions each year, pushing uptake of fast-acting oxidizing biocides such as DBNPA and glutaraldehyde that meet tightening toxicity caps. AI dosing tools fine-tune ppm levels, cutting waste and helping plants stay below discharge limits for residual oxidants.
Scale inhibitors, coagulants, and flocculants continue to support large base-load volumes. Bio-derived tannin coagulants achieve PFAS capture efficiencies comparable to alum, but higher purchase prices restrict them to sustainability-driven customers. Oxidants, antifoams, oxygen scavengers, and sludge conditioners serve niche applications, yet they deliver stable gross margins because performance specs differ by site and carry high switching costs. As compliance thresholds and reuse rates rise, specialty blends rather than single-function reagents are set to propel the industrial water treatment chemicals market size over the forecast window.
Note: Segment shares of all individual segments available upon report purchase
By End-User Industry: power sector remains anchor while oil and gas drives incremental growth
The power industry accounted for 36.21% of the industrial water treatment chemicals market size in 2024, reflecting the sector’s heavy reliance on high-purity boiler feedwater and the need to control scaling in cooling towers that handle volumes up to 100,000 m³/day per facility. Treatment programs layer phosphate-free scale inhibitors, bromine-based biocides, and neutralizing amines to secure turbine output and meet effluent norms. Steady electricity demand and incremental capacity additions sustain a large but mature revenue pool.
Conversely, oil and gas operations record the fastest growth at 6.71% CAGR. Unconventional wells pump nine barrels of produced water for every barrel of oil, each barrel laden with high salinity, dissolved organics, and radionuclides. Chemical suppliers craft high-flashpoint demulsifiers, high-TDS scale inhibitors, and sulfide-specific oxidants capable of functioning at 140 °C. Field service contracts often bundle logistics, on-site labs, and digital monitoring, boosting average revenue per well. Pulp and paper mills, metals processing, and chemical manufacturing round out demand. They adopt advanced coagulants for fiber recovery, heavy-metal precipitants, and sludge dewatering polymers as regulators clamp down on color, COD, and metal discharge limits.
Note: Segment shares of all individual segments available upon report purchase
Geography Analysis
Asia-Pacific led the industrial water treatment chemicals market with 37.58% revenue share in 2024, driven by rapid industrialization and expanding municipal infrastructure. China operates more than 580 membrane-based wastewater plants treating 6.7 million m³ each day, which lifts demand for anti-scalants, biocides, and cleaning chemicals that maintain permeate flux[2]Resources, Conservation and Recycling, “Membrane Installations in China,” elsevier.com. India’s water initiatives, including the Jal Jeevan Mission, sustain annual growth of 9.7% through 2025 and open new municipal bidding rounds that specify both conventional and advanced chemistries.
North America remains a technology bellwether. EPA PFAS limits require sweeping plant retrofits, pushing utilities to procure surfactant-enhanced coagulants, granular activated carbon replacement chemicals, and oxidative cleaners at scale. Shale basins add high-volume demand for specialty oxidants, biocides, and corrosion inhibitors formulated for brines exceeding 150,000 mg/L TDS. Europe holds a mature but innovation-driven user base that favors bio-based polymers and low-phosphorus blends aligned with Green Deal goals.
The Middle East & Africa region is projected to record a 7.12% CAGR, the fastest globally. USD 80 billion earmarked for water projects in Saudi Arabia and wider Gulf desalination expansion underpin adoption of anti-scalants and membrane cleaners designed for high-salinity RO plants. Industrial clusters in the United Arab Emirates and Egypt pursue zero-liquid-discharge systems, bolstering uptake of evaporation-control antiscalants and multi-cycle corrosion inhibitors. Latin America posts steady growth, led by mining hot-spots in Chile and Peru that need reagents for tailings water recycling and arsenic removal.
Competitive Landscape
Competitive intensity is moderate, with leading firms accelerating consolidation to secure technology platforms and regional footprint. Veolia’s acquisition of the remaining 30% stake in Water Technologies and Solutions gives the firm end-to-end control of chemicals, equipment, and AI diagnostics, with targeted EUR 90 million in extra synergies by 2027. Ecolab bought Barclay Water Management for USD 50 million in November 2024, adding proprietary monochloramine technology into its ECOLAB3D digital suite. These moves underline a shift toward integrated solutions that bind customers via performance-based contracts.
Solenis invests USD 193 million to expand U.S. capacity for polyvinylamine polymers used in high-strength coagulants, complementing its 2024 purchase of BASF’s mining flocculants business. Kemira allocates EUR 500 million toward renewable-content products by 2030, anticipating surging preference for bio-based flocculants and corrosion inhibitors across Europe. Smaller regional players focus on niche formulations but face raw-material volatility and tightening toxicity regulations that raise compliance costs. Digital differentiation stands out: suppliers offering cloud dashboards linked to inline sensors lock in multiyear service contracts and boost cross-sell of specialty blends within the industrial water treatment chemicals market.
Industrial Water Treatment Chemicals Industry Leaders
-
Kemira
-
Ecolab Inc.
-
Solenis LLC
-
SNF Group
-
Kurita Water Industries Ltd
- *Disclaimer: Major Players sorted in no particular order
Recent Industry Developments
- May 2025: Veolia completed acquisition of CDPQ’s 30% stake in Water Technologies and Solutions, achieving full ownership to unlock EUR 90 million of additional cost synergies by 2027.
- November 2024: Ecolab acquired Barclay Water Management for USD 50 million, adding iChlor Monochloramine System technology and integrating it into the ECOLAB3D digital platform.
Global Industrial Water Treatment Chemicals Market Report Scope
Water treatment is used to optimize most water-based industrial processes, such as heating, cooling, processing, cleaning, and rinsing, to reduce operating costs and risks. Poor water treatment lets water interact with the surfaces of pipes and vessels that contain it. The market is segmented based on product type, end-user, and geography. The market is segmented by product type into antifoams, oxygen scavengers, corrosion inhibitors, biocides and disinfectants, oxidants, pH conditioners, sludge conditioners, scale inhibitors, and other product types. The market is segmented by end-users into oil and gas, power, paper, metal and mining, chemical, and other industries. The report offers market size and forecasts for 16 countries across major regions. For each segment, market sizing and forecasts are based on revenue (USD) for all the above segments.
| By Product Type | Scale Inhibitors | ||
| Corrosion Inhibitors | |||
| Biocides and Disinfectants | |||
| Coagulants and Flocculants | |||
| pH Conditioners | |||
| Antifoams | |||
| Oxygen Scavengers | |||
| Sludge Conditioners | |||
| Oxidants | |||
| Others | |||
| By End-user Industry | Oil and Gas | ||
| Power | |||
| Paper | |||
| Metals and Mining | |||
| Chemicals | |||
| Other End-user Industries | |||
| By Geography | Asia-Pacific | China | |
| India | |||
| Japan | |||
| South Korea | |||
| Rest of Asia-Pacific | |||
| North America | United States | ||
| Canada | |||
| Mexico | |||
| Europe | Germany | ||
| United Kingdom | |||
| France | |||
| Italy | |||
| Russia | |||
| Rest of Europe | |||
| South America | Brazil | ||
| Argentina | |||
| Rest of South America | |||
| Middle East and Africa | Saudi Arabia | ||
| United Arab Emirates | |||
| South Africa | |||
| Rest of Middle East and Africa | |||
| Scale Inhibitors |
| Corrosion Inhibitors |
| Biocides and Disinfectants |
| Coagulants and Flocculants |
| pH Conditioners |
| Antifoams |
| Oxygen Scavengers |
| Sludge Conditioners |
| Oxidants |
| Others |
| Oil and Gas |
| Power |
| Paper |
| Metals and Mining |
| Chemicals |
| Other End-user Industries |
| Asia-Pacific | China |
| India | |
| Japan | |
| South Korea | |
| Rest of Asia-Pacific | |
| North America | United States |
| Canada | |
| Mexico | |
| Europe | Germany |
| United Kingdom | |
| France | |
| Italy | |
| Russia | |
| Rest of Europe | |
| South America | Brazil |
| Argentina | |
| Rest of South America | |
| Middle East and Africa | Saudi Arabia |
| United Arab Emirates | |
| South Africa | |
| Rest of Middle East and Africa |
Key Questions Answered in the Report
What is the current Industrial Water Treatment Chemicals Market size?
The market is valued at USD 23.53 billion in 2025 and is projected to reach USD 31.55 billion by 2030.
Which product segment leads the market?
Corrosion inhibitors hold the top position, representing 24.16% of industrial water treatment chemicals market share in 2024.
Which region is growing the fastest?
The Middle East & Africa region is forecast to expand at a 7.12% CAGR through 2030, outpacing other regions.
Why are PFAS regulations important for chemical demand?
Stricter PFAS limits force utilities to adopt enhanced coagulants and post-treatment chemicals, significantly boosting market volumes.
How is AI changing chemical consumption?
Real-time dosing platforms cut overdosing by 15-25%, reducing waste while ensuring compliance, and are becoming a key differentiator for suppliers.
Page last updated on: July 11, 2025